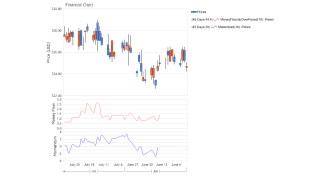
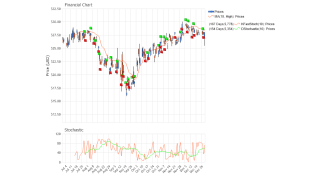
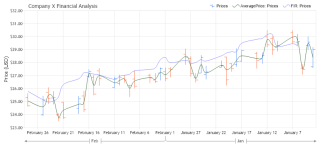
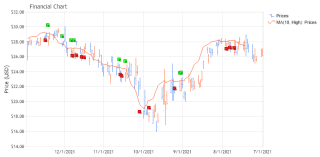
- FinancialMA
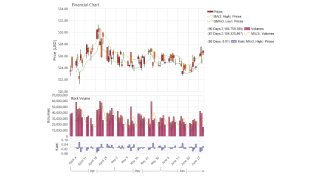
Demonstrates the use of the SimpleMovingAverages and GeometricalMovingAverage.
- Aroon Indicators
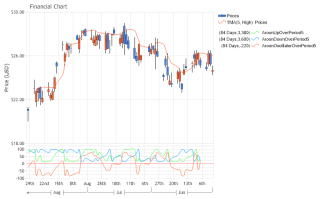
Demonstrates the use of Aroon indicators.
- Chaikin Indicators
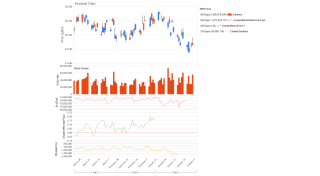
Demonstrates the use of Chaikin indicators.
- Commodity Channel Index
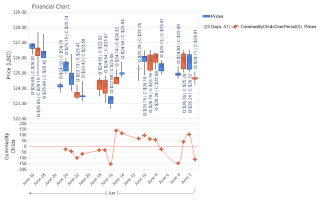
Demonstrates the use of financial indicator CommodityChanelIndex.
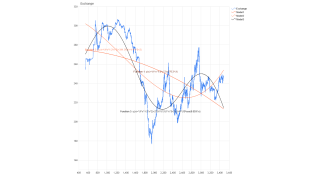
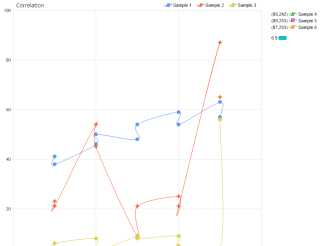
- Correlation
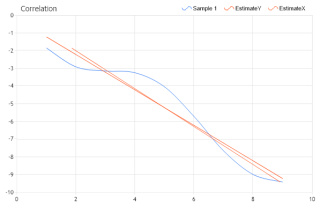
Demonstrates the use of LeastSquaresRegressionLineX and LeastSquaresRegressionLineY.
- Filters
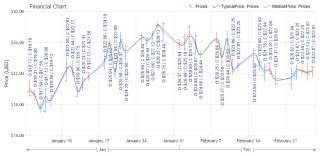
Demonstrates the use of financial indicators MedianPrice and TypicalPrice.
- ZScore
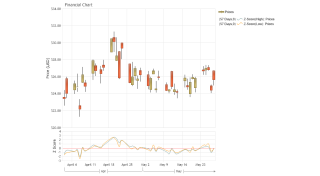
Demonstrates the use of ZScore indicator.
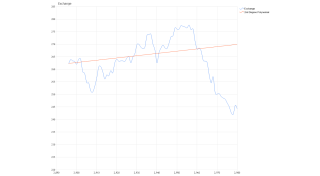
- Trendline
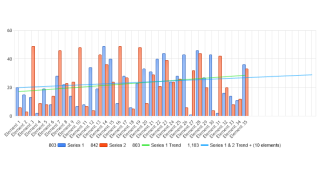
Derive trend lines from your data.
- Trendline Scatter
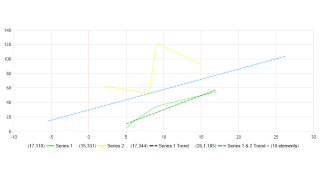
Derive trend lines from your scatter data.
- Date Trend Line
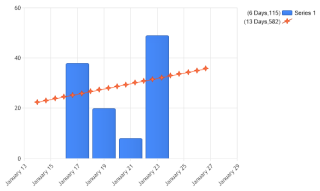
Demonstrates adding a trendline to data with DateTime x values.
- Market Strength
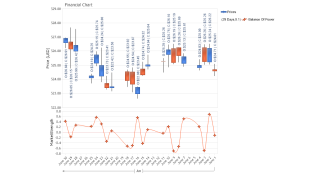
Demonstrates the use of BalanceOfPower financial indicator.
- Financial One Value Indicators
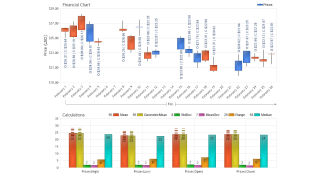
Demonstrates the use of one-value financial indicators arithmetic mean, geometric mean, standard deviation, mean deviation, range and median.
- Frequency Table
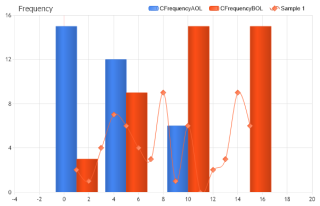
Demonstrates the use of statistical procedures to summarize quantitative data from within DataPresentation class.
- Oscillators
Demonstrates the use of financial indicators : Momentum and MoneyFlowIndexOverPeriod.
- Rate Charts
Demonstrates creating a derived series through division of 2 existing series.
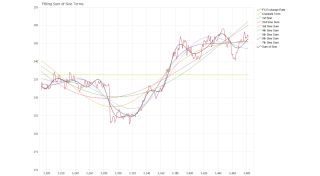
- Running Sum
Demonstrates use of a running sum derived series based on an invisible series.
- Crossing Signal
Demonstrates the use of the Crossing Signal indicators within Stochastic.
- Extreme Value Signal
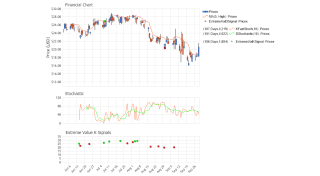
Demonstrates the use of the Extreme value signal indicators.
- General Linear
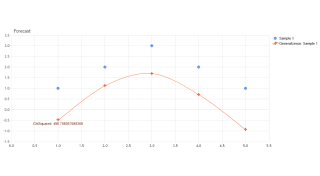
Demonstrates the use of GeneralLinear indicator from within forecasting.
- General Linear Fit
Demonstrates the use of GeneralLinear Forecasting engine in order to find the function of best fit from three functions spaces.
- Logarithmic Fitting
Demonstrates the use of GeneralLinear forecasting engine in order to find the function of best fit from three functions spaces.
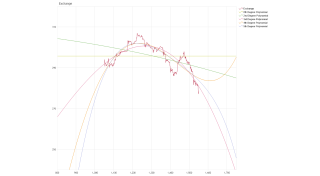
- Non Linear Polynomial
Demonstrates the use of NonLinear Forecasting model in order to find the function of best fit.
- Polynomial Fitting
Demonstrates the use of GeneralLinear forecasting engine in order to find the function of best fit from three functions spaces.
- Polynomial Fitting Extended
Demonstrates the use of GeneralLinear forecasting engine in order to find the function of best fit from three functions spaces.
- Residuals
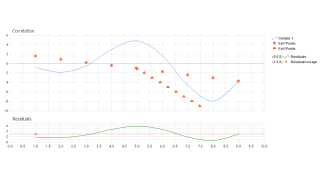
Demonstrates the use of LeastSquaresRegressionLineX and LeastSquaresRegressionLineY from within Correlation class.
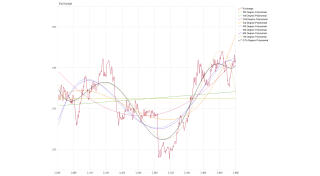
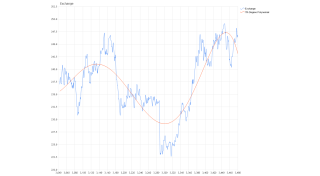
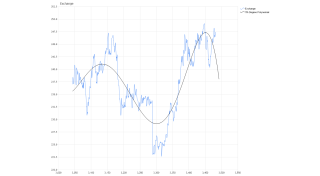
- Sine Fitting
Demonstrates the use of GeneralLinear forecasting engine in order to find the function of best fit from three functions spaces.
- Stochastic
Demonstrates the use of the K% Stochastic and D% Stochastic.
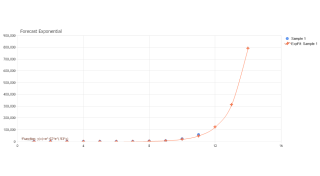
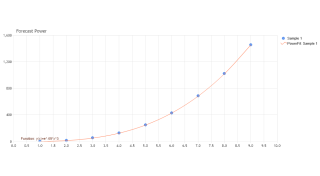
- Trend Line Exponential
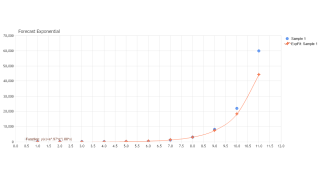
Demonstrates the use of TrendLineExponential from within ForecatEngine which find the best fitting exponential curve to sets of data.
- Trend Line Exponential Ext
Demonstrates the use of TrendLineExponential from within ForecatEngine which find the best fitting exponential curve to sets of data.
- Trend Line Logarithmic
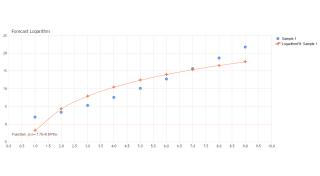
Demonstrates the use of TrendLineLogarithmic from within Forecasting which find the best fitting logarithmical curve to sets of data.
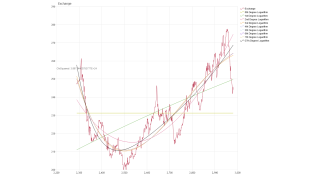
- Trend Line Polynomial
Demonstrates the use of TrendLine Forecasting engine in order to find the function of best fit for the seventh degree polynomial.
- Trend Line Polynomial Ext
Demonstrates the use of TrendLine Forecasting engine in order to find the function of best fit for the seventh degree polynomial.
- Trend Line Power
Demonstrates the use of TrendLinePower from within Forecasting which find the best fitting power curve to sets of data.
- Volume Indicators
Demonstrates the use of the Volume indicators.
- ChartArea Data Distribution
Demonstrates some quality control features like median, mean and percentile and integrate them within an element in a separate chart area.
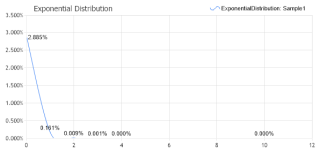
- Exponential Distribution
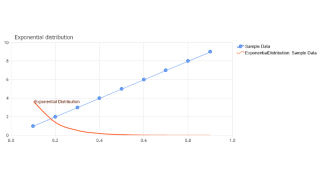
Demonstrates the use of ExponentialDistribution method from the StatisticalEngine. This method return the exponential distribution for a series when the standard deviation is known.
- Finite Impulse Response
Demonstrates the use of financial indicator Finite Impulse Response.
- Log Normal Distribution
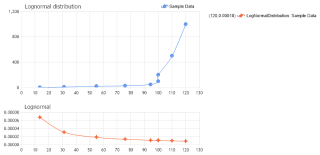
Demonstrates the use of LognormalDistribution method from the StatisticalEngine. This method return the lognormal distribution for a series when the standard deviation is known.
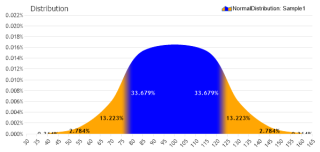
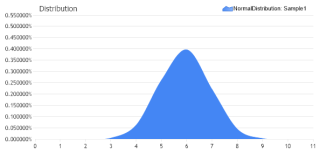
- Normal Distribution
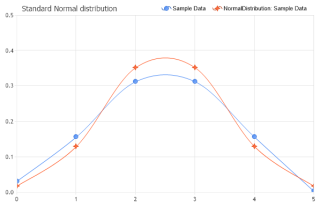
Demonstrates the use of NormalDistribution method from the StatisticalEngine. This method return the normal distribution for a series when the standard deviation is known. The mean is calculated using the arithmetic mean of the XValues of the given series.
- Price Action Indicator
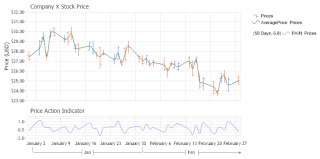
Demonstrates the use of financial indicators AveragePrice and PriceActionIndicator.
- RChart
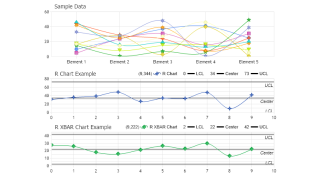
Demonstrates the use of R-Chart and R-XBAR chart.
- Run Chart
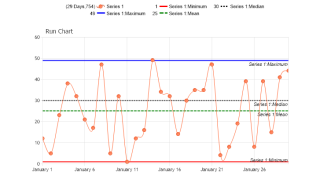
Demonstrates the Run Chart.
- SChart
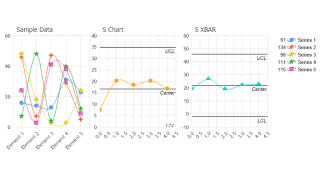
Demonstrates the use of S-Chart and S-XBAR chart.
- Market Facilitation Index
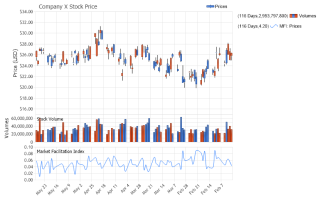
Demonstrates the use of the Market Facilitation Index indicator.
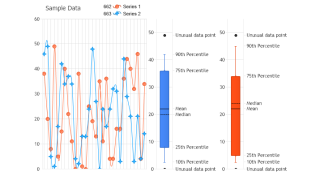
- Series Data Distribution
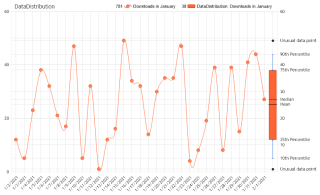
Demonstrates some quality control features like median, mean and percentile and integrate them within an element.
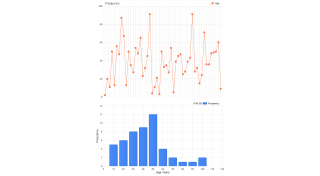
- Age Histogram
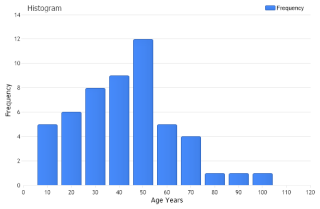
Demonstrates the use of statistical procedures for summarize quantitative data from within StatisticalEngine.
- Directional Movement
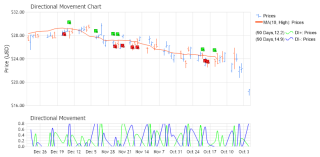
Demonstrates the use of the DM+ and DM-
- DMISignal
Demonstrates the use of the DMI Signal indicator.
- Exponential Distribution 1
Demonstrates the use of Exponential Distribution within StatisticalEngine.
- Exponential Distribution 2
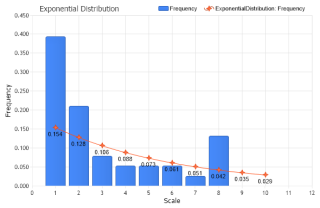
Demonstrates the use of Exponential Distribution and Relative Frequency Table for summarize quantitative data from within StatisticalEngine.
- Financial Kurtosis Indicator
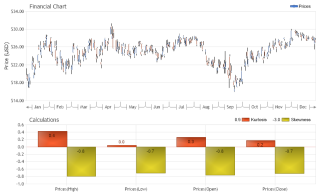
Demonstrates the use of one-value financial indicators kurtosis and skewness.
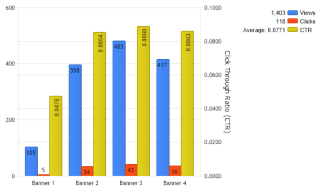
- Forecast Traffic
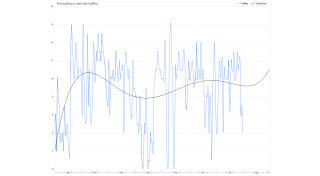
Demonstrates the use of TrendLine Forecasting engine in a real-world situation for predicting the number of click generated by an on-line add based on past trends.
- Histogram
Demonstrates the use of statistical procedures for summarize quantitative data from within StatisticalEngine.
- Normal Distribution 1
Demonstrates the use of NormalDistribution within StatisticalEngine.
- Normal Distribution 2
Demonstrates the use of NormalDistribution within StatisticalEngine.
- Soft Drinks Histogram
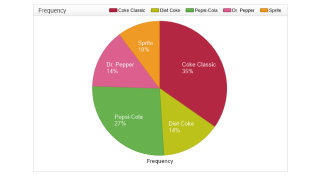
Demonstrates the use of statistical procedures for summarize quantitative data from within StatisticalEngine.
- True Range
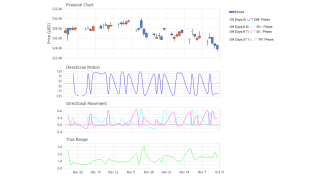
Demonstrates the use of the TrueRange and DirectionalMotion indicators.
- Pearson
Demonstrates the use of LeastSquaresRegressionLineX and LeastSquaresRegressionLineY from
- BesselI
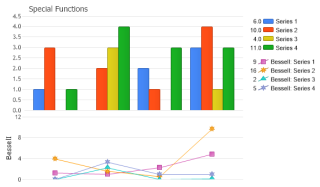
Demonstrates the bessel I function.
- BesselJ
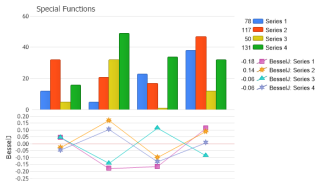
Demonstrates bessel J function.
- BesselK
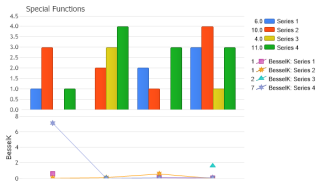
Demonstrates bessel K function.
- BesselY

Demonstrates the bessel Y function.
- Beta
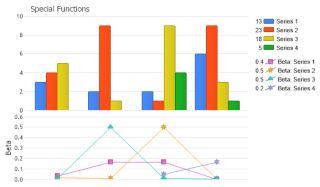
Demonstrates the beta function.
- GammaP
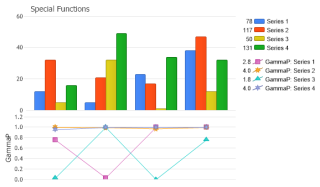
Demonstrates the Gamma P function.
- GammaQ
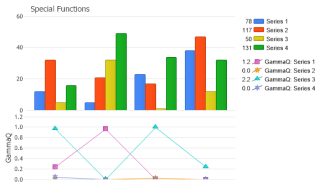
Demonstrates the Gamma Q function.
- SMAUsage
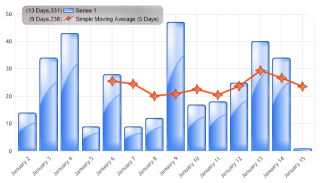
Demonstrates using a simple moving average over an n number of days.
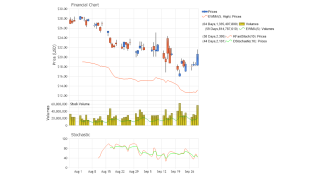
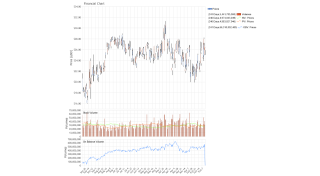
- Bollinger Bands
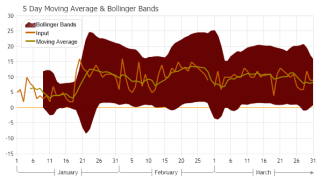
Demonstrates creating a 5 Day Moving Average and Bollinger Bands chart using live data.