Forecast Traffic
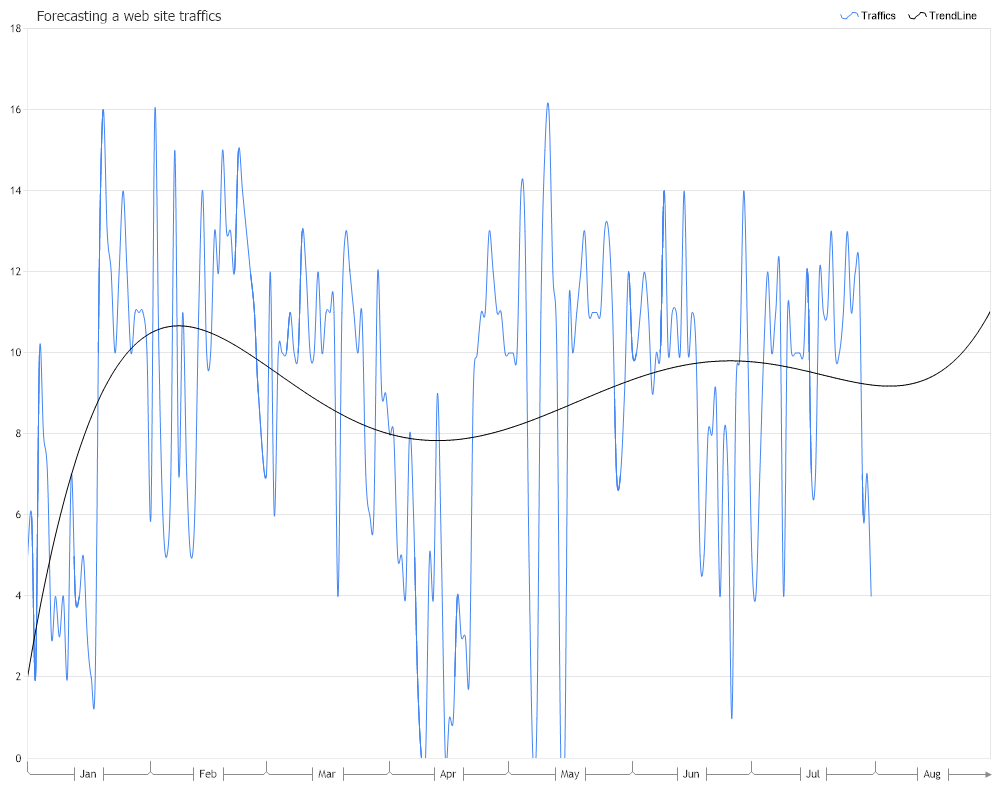
Demonstrates the use of TrendLine Forecasting engine in a real-world situation for predicting the number of click generated by an on-line add based on past trends.
<%@ Page Language="C#" Description="dotnetCHARTING Component" %>
<%@ Register TagPrefix="dotnet" Namespace="dotnetCHARTING" Assembly="dotnetCHARTING"%>
<%@ Import Namespace="System.Drawing" %>
<%@ Import Namespace="System.Drawing.Drawing2D" %>
<%@ Import Namespace="dotnetCHARTING"%>
<html xmlns="http://www.w3.org/1999/xhtml">
<head>
<title>.netCHARTING Forecasting Sample</title>
<script runat="server">
void Page_Load(Object sender,EventArgs e)
{
// Demonstrates the use of TrendLine Forecasting engine in a real-world
// situation for predicting the number of click generated by an on-line add
// based on past trends.
// The Forecast Chart
ForecastChart.Title="Forecasting a web site traffics";
ForecastChart.TempDirectory="temp";
ForecastChart.Debug=true;
ForecastChart.Size = "1000x800";
ForecastChart.LegendBox.Template ="%icon %name";
ForecastChart.YAxis.Scale = Scale.Range;
ForecastChart.TitleBox.Position = TitleBoxPosition.FullWithLegend;
ForecastChart.DefaultSeries.DefaultElement.Marker.Visible = false;
ForecastChart.DefaultSeries.Type = SeriesType.Spline;
// Modify the x axis labels.
ForecastChart.XAxis.Scale = Scale.Time;
ForecastChart.XAxis.TimeScaleLabels.Mode = TimeScaleLabelMode.Dynamic;
ForecastChart.XAxis.TimeScaleLabels.RangeIntervals.Add(TimeInterval.Month);
ForecastChart.XAxis.TimeScaleLabels.Mode = TimeScaleLabelMode.Hidden;
ForecastChart.XAxis.TimeScaleLabels.MonthFormatString = "MMM";
ForecastChart.XAxis.Minimum = new DateTime(2020, 1, 1);
// Here we use data caching because the data history do not change.
SeriesCollection scForecast = (SeriesCollection) Cache["scForecastCache"];
if ( scForecast == null ) {
// The Forecast data
DataEngine de = new DataEngine ();
de.ConnectionString = ConfigurationManager.AppSettings["DNCConnectionString"];
de.DateGrouping = TimeInterval.Days;
de.StartDate = new DateTime(2020,1,1,0,0,0);
de.EndDate = new DateTime(2020,7,31,23,59,59);
de.SqlStatement= @"SELECT TrafficDate, Clicks AS q FROM TrafficReport WHERE TrafficDate >= #STARTDATE# AND TrafficDate <= #ENDDATE# ORDER BY TrafficDate ";
//Add a series
scForecast = de.GetSeries ();
Cache.Insert("scForecastCache", scForecast);
}
ForecastChart.SeriesCollection.Add (scForecast);
scForecast[0].Name = "Traffics";
scForecast[0].Type = SeriesType.Spline;
/*
* Takes off the marker off the line and spline series.
*/
ForecastChart.DefaultSeries.DefaultElement.Marker = new ElementMarker (ElementMarkerType.None);
ForecastChart.ChartAreaLayout.Mode = ChartAreaLayoutMode.Vertical;
// We generate the best fitting curve of a 5th degree polynomial.
// Also we will forecast the values for the next 30 periods
Series trendLinePoly = new Series();
trendLinePoly = ForecastEngine.TrendLinePolynomial(scForecast[0], 5, 1, 30, 0);
trendLinePoly.Name = "TrendLine";
trendLinePoly.Type = SeriesType.Spline;
ForecastChart.SeriesCollection.Add(trendLinePoly);
}
</script>
</head>
<body>
<div style="text-align:center">
<dotnet:Chart id="ForecastChart" runat="server"/>
</div>
</body>
</html>
<%@ Page Language="vb" Description="dotnetCHARTING Component" %>
<%@ Register TagPrefix="dotnet" Namespace="dotnetCHARTING" Assembly="dotnetCHARTING"%>
<%@ Import Namespace="System.Drawing" %>
<%@ Import Namespace="System.Drawing.Drawing2D" %>
<%@ Import Namespace="dotnetCHARTING"%>
<html xmlns="http://www.w3.org/1999/xhtml">
<head>
<title>.netCHARTING Forecasting Sample</title>
<script runat="server">
Sub Page_Load(ByVal sender As Object, ByVal e As EventArgs)
' Demonstrates the use of TrendLine Forecasting engine in a real-world
' situation for predicting the number of click generated by an on-line add
' based on past trends.
' The Forecast Chart
ForecastChart.Title="Forecasting a web site traffics"
ForecastChart.TempDirectory="temp"
ForecastChart.Debug=True
ForecastChart.Size = "1000x800"
ForecastChart.LegendBox.Template ="%icon %name"
ForecastChart.YAxis.Scale = Scale.Range
ForecastChart.TitleBox.Position = TitleBoxPosition.FullWithLegend
ForecastChart.DefaultSeries.DefaultElement.Marker.Visible = False
ForecastChart.DefaultSeries.Type = SeriesType.Spline
' Modify the x axis labels.
ForecastChart.XAxis.Scale = Scale.Time
ForecastChart.XAxis.TimeScaleLabels.Mode = TimeScaleLabelMode.Dynamic
ForecastChart.XAxis.TimeScaleLabels.RangeIntervals.Add(TimeInterval.Month)
ForecastChart.XAxis.TimeScaleLabels.Mode = TimeScaleLabelMode.Hidden
ForecastChart.XAxis.TimeScaleLabels.MonthFormatString = "MMM"
ForecastChart.XAxis.Minimum = New DateTime(2020, 1, 1)
' Here we use data caching because the data history do not change.
Dim scForecast As SeriesCollection = CType(Cache("scForecastCache"), SeriesCollection)
If scForecast Is Nothing Then
' The Forecast data
Dim de As DataEngine = New DataEngine ()
de.ConnectionString = ConfigurationManager.AppSettings("DNCConnectionString")
de.DateGrouping = TimeInterval.Days
de.StartDate = New DateTime(2020,1,1,0,0,0)
de.EndDate = New DateTime(2020,7,31,23,59,59)
de.SqlStatement= "SELECT TrafficDate, Clicks AS q FROM TrafficReport WHERE TrafficDate >= #STARTDATE# AND TrafficDate <= #ENDDATE# ORDER BY TrafficDate "
'Add a series
scForecast = de.GetSeries ()
Cache.Insert("scForecastCache", scForecast)
End If
ForecastChart.SeriesCollection.Add (scForecast)
scForecast(0).Name = "Traffics"
scForecast(0).Type = SeriesType.Spline
'
'* Takes off the marker off the line and spline series.
'
ForecastChart.DefaultSeries.DefaultElement.Marker = New ElementMarker (ElementMarkerType.None)
ForecastChart.ChartAreaLayout.Mode = ChartAreaLayoutMode.Vertical
' We generate the best fitting curve of a 5th degree polynomial.
' Also we will forecast the values for the next 30 periods
Dim trendLinePoly As Series = New Series()
trendLinePoly = ForecastEngine.TrendLinePolynomial(scForecast(0), 5, 1, 30, 0)
trendLinePoly.Name = "TrendLine"
trendLinePoly.Type = SeriesType.Spline
ForecastChart.SeriesCollection.Add(trendLinePoly)
End Sub
</script>
</head>
<body>
<div style="text-align:center">
<dotnet:Chart id="ForecastChart" runat="server"/>
</div>
</body>
</html>