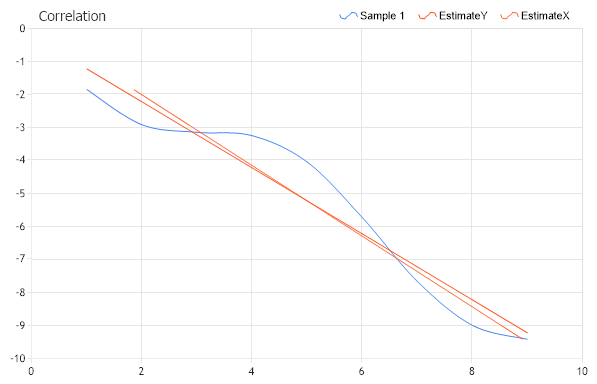
Gallery
Correlation
<%@ Page Language="C#" Description="dotnetCHARTING Component" %>
<%@ Register TagPrefix="dotnet" Namespace="dotnetCHARTING" Assembly="dotnetCHARTING"%>
<%@ Import Namespace="System.Drawing" %>
<%@ Import Namespace="System.Drawing.Drawing2D" %>
<html xmlns="http://www.w3.org/1999/xhtml">
<head>
<title>.netCHARTING Sample</title>
<script runat="server">
void Page_Load(Object sender,EventArgs e)
{
// Demonstrates the use of LeastSquaresRegressionLineX and LeastSquaresRegressionLineY from
// within Correlation class
// The Correlation Chart
CorrelationChart.Title="Correlation";
CorrelationChart.TempDirectory="temp";
CorrelationChart.Debug=true;
CorrelationChart.Type = ChartType.Scatter;
CorrelationChart.Size = "600x400";
CorrelationChart.LegendBox.Template ="%icon %name";
CorrelationChart.XAxis.Scale = Scale.Normal;
CorrelationChart.XAxis.Interval = 2;
CorrelationChart.XAxis.FormatString = "n0";
CorrelationChart.TitleBox.Position = TitleBoxPosition.FullWithLegend;
CorrelationChart.DefaultSeries.DefaultElement.Marker.Visible = false;
CorrelationChart.DefaultSeries.Type = SeriesType.Spline;
// Generate the sample data.
SeriesCollection scorrelation = new SeriesCollection();
Series sampledata1 = new Series ("Sample 1");
for ( int b=1; b<10; b++) {
Element el = new Element();
el.YValue = -Math.Sin(b)-b;
el.XValue = b ;
sampledata1.Elements.Add (el);
}
scorrelation.Add (sampledata1);
CorrelationChart.SeriesCollection.Add (scorrelation);
// Here we create a series which describe the regression line of Y on X using the
// method of least squares
CorrelationChart.SeriesCollection.Add ( StatisticalEngine.LeastSquaresEstimateY("EstimateY",sampledata1) );
// Here we create a series which describe the regression line of X on Y using the
// method of least squaresLeastSquaresEstimatex
Series estimateX = StatisticalEngine.LeastSquaresEstimateX("EstimateX", sampledata1);
estimateX.DefaultElement.Color = Color.FromArgb(255,99,49);
CorrelationChart.SeriesCollection.Add (estimateX);
}
</script>
</head>
<body>
<div style="text-align:center">
<dotnet:Chart id="CorrelationChart" runat="server"/>
</div>
</body>
</html>
<%@ Page Language="vb" Description="dotnetCHARTING Component" %>
<%@ Register TagPrefix="dotnet" Namespace="dotnetCHARTING" Assembly="dotnetCHARTING"%>
<%@ Import Namespace="System.Drawing" %>
<%@ Import Namespace="System.Drawing.Drawing2D" %>
<html xmlns="http://www.w3.org/1999/xhtml">
<head>
<title>.netCHARTING Sample</title>
<script runat="server">
Sub Page_Load(ByVal sender As Object, ByVal e As EventArgs)
' Demonstrates the use of LeastSquaresRegressionLineX and LeastSquaresRegressionLineY from
' within Correlation class
' The Correlation Chart
CorrelationChart.Title="Correlation"
CorrelationChart.TempDirectory="temp"
CorrelationChart.Debug=True
CorrelationChart.Type = ChartType.Scatter
CorrelationChart.Size = "600x400"
CorrelationChart.LegendBox.Template ="%icon %name"
CorrelationChart.XAxis.Scale = Scale.Normal
CorrelationChart.XAxis.Interval = 2
CorrelationChart.XAxis.FormatString = "n0"
CorrelationChart.TitleBox.Position = TitleBoxPosition.FullWithLegend
CorrelationChart.DefaultSeries.DefaultElement.Marker.Visible = False
CorrelationChart.DefaultSeries.Type = SeriesType.Spline
' Generate the sample data.
Dim scorrelation As SeriesCollection = New SeriesCollection()
Dim sampledata1 As Series = New Series ("Sample 1")
For b As Integer = 1 To 9
Dim el As Element = New Element()
el.YValue = -Math.Sin(b)-b
el.XValue = b
sampledata1.Elements.Add (el)
Next b
scorrelation.Add (sampledata1)
CorrelationChart.SeriesCollection.Add (scorrelation)
' Here we create a series which describe the regression line of Y on X using the
' method of least squares
CorrelationChart.SeriesCollection.Add (StatisticalEngine.LeastSquaresEstimateY("EstimateY",sampledata1))
' Here we create a series which describe the regression line of X on Y using the
' method of least squaresLeastSquaresEstimatex
Dim estimateX As Series = StatisticalEngine.LeastSquaresEstimateX("EstimateX", sampledata1)
estimateX.DefaultElement.Color = Color.FromArgb(255,99,49)
CorrelationChart.SeriesCollection.Add (estimateX)
End Sub
</script>
</head>
<body>
<div style="text-align:center">
<dotnet:Chart id="CorrelationChart" runat="server"/>
</div>
</body>
</html>
- Sample FilenameCorrelation.aspx
- VersionLegacy (Pre 3.0)
- Uses DatabaseNo