Gallery
<%@ Page Language="C#" Description="dotnetCHARTING Component" %>
<%@ Register TagPrefix="dotnet" Namespace="dotnetCHARTING" Assembly="dotnetCHARTING"%>
<%@ Import Namespace="System.Drawing" %>
<%@ Import Namespace="System.Drawing.Drawing2D" %>
<html xmlns="http://www.w3.org/1999/xhtml">
<head>
<title>.netCHARTING Sample</title>
<script runat="server">
void Page_Load(Object sender,EventArgs e)
{
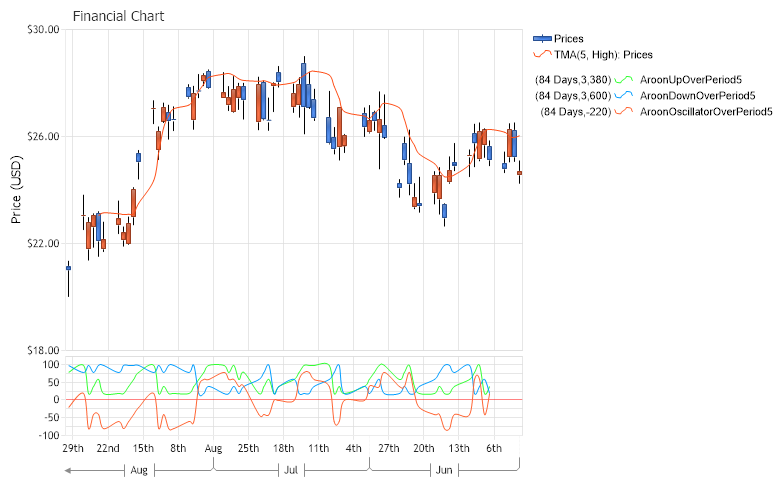
// Demonstrates the use of Aroon indicators.
// The Financial Chart
FinancialChart.Title="Financial Chart";
FinancialChart.TempDirectory="temp";
FinancialChart.Debug=true;
FinancialChart.ShadingEffect = true;
FinancialChart.LegendBox.Template ="%icon %name";
FinancialChart.Size="800X500";
FinancialChart.XAxis.Scale = Scale.Time;
FinancialChart.DefaultSeries.Type = SeriesType.Spline;
FinancialChart.DefaultSeries.DefaultElement.Marker.Type = ElementMarkerType.None;
// For Aroon indicators the time scale is inverted (i.e. the first element of the series is the newest)
FinancialChart.XAxis.InvertScale = true;
FinancialChart.YAxis.Label.Text = "Price (USD)";
FinancialChart.YAxis.FormatString = "currency";
FinancialChart.YAxis.Scale = Scale.Range;
// Modify the x axis labels.
FinancialChart.XAxis.TimeInterval = TimeInterval.Week;
FinancialChart.XAxis.TimeScaleLabels.Mode = TimeScaleLabelMode.Smart;
FinancialChart.XAxis.TimeScaleLabels.DayFormatString = "o";
FinancialChart.XAxis.TimeScaleLabels.RangeIntervals.Add(TimeInterval.Month);
FinancialChart.XAxis.TimeScaleLabels.MonthFormatString = "MMM";
// Setup the dataEngine to get data.
DataEngine priceDataEngine = new DataEngine(ConfigurationManager.AppSettings["DNCConnectionString"]);
priceDataEngine.ChartObject = FinancialChart;
priceDataEngine.ChartType = ChartType.Financial;
priceDataEngine.DateGrouping = TimeInterval.Day;
priceDataEngine.StartDate = new DateTime (2021,6,1);
priceDataEngine.EndDate = new DateTime (2021,8,30);
// For this example we import data from the FinancialCompany table from within chartsample.mdb
priceDataEngine.SqlStatement = @"SELECT TransDate, HighPrice, LowPrice, OpenPrice, ClosePrice FROM FinancialCompany WHERE TransDate >= #STARTDATE# AND TransDate <= #ENDDATE# ORDER BY TransDate Desc";
priceDataEngine.DataFields = "xAxis=TransDate,High=HighPrice,Low=LowPrice,Open=OpenPrice,Close=ClosePrice";
// Get prices from the data engine.
SeriesCollection sc = priceDataEngine.GetSeries ();
Series prices = null;
if(sc.Count>0)
prices = sc[0];
else
return;
prices.DefaultElement.ShowValue=false;
prices.DefaultElement.ToolTip="L:%Low-H:%High";
prices.DefaultElement.SmartLabel.Font = new Font("Arial", 6);
prices.DefaultElement.SmartLabel.Text="O:%Open-C:%Close";
prices.Type = SeriesTypeFinancial.CandleStick;
// Trim out weekends from the prices series and add it to the chart.
CalendarPattern cp = new CalendarPattern (TimeInterval.Day, TimeInterval.Week, "1000001");
prices.Trim (cp, ElementValue.XDateTime);
prices.Name = "Prices";
FinancialChart.SeriesCollection.Add (prices);
// Here we create a new chart area for displaying the series for Aroon indicators.
// Aroon chart area
ChartArea aroonChartArea = new ChartArea ();
aroonChartArea.HeightPercentage = 20;
// A new y axis is assigned in order to loose the original y axis' settings.
aroonChartArea.YAxis = new Axis ();
aroonChartArea.YAxis.ZeroTick.GridLine.Color = Color.FromArgb(125, 255, 0, 0);
FinancialChart.ExtraChartAreas.Add (aroonChartArea);
// AroonUpOverPeriod - measures the relative time since the last highest high over a peroid of five days.
Series aroonUpOverPeriod = FinancialEngine.AroonUpOverPeriod(prices,5);
aroonUpOverPeriod.Name = " AroonUpOverPeriod5";
aroonUpOverPeriod.DefaultElement.Color = Color.FromArgb(49,255,49);
aroonChartArea.SeriesCollection.Add (aroonUpOverPeriod);
// AroonDownOverPeriod - indicator which measures the relative time since the last lowest low over
// a period of five days.
Series aroonDownOverPeriod = FinancialEngine.AroonDownOverPeriod(prices,5);
aroonDownOverPeriod.Name = " AroonDownOverPeriod5";
aroonDownOverPeriod.DefaultElement.Color = Color.FromArgb(0,156,255);
aroonChartArea.SeriesCollection.Add (aroonDownOverPeriod);
// AroonOscillatorOverPeriod - Evaluates the Aroon Oscillator over the last 5 days which is given by the
// following formulae: Aroon Oscillator = (Aroon Up Indicator) - (Aroon DownIndicator).
Series aroonOscillatorOverPeriod = FinancialEngine.AroonOscillatorOverPeriod(prices,5);
aroonOscillatorOverPeriod.Name = " AroonOscillatorOverPeriod5";
aroonOscillatorOverPeriod.DefaultElement.Color = Color.FromArgb(255,99,49);
aroonChartArea.SeriesCollection.Add (aroonOscillatorOverPeriod);
// The Aroon indicator has been developed in order to indicate when a trending
// approach such as moving averages or the trading range approach such as the
// application of oscillators in more appropriate.
FinancialChart.SeriesCollection.Add (FinancialEngine.TriangularMovingAverage (prices, ElementValue.High, 5));
}
</script>
</head>
<body>
<div style="text-align:center">
<dotnet:Chart id="FinancialChart" runat="server"/>
</div>
</body>
</html>
<%@ Page Language="vb" Description="dotnetCHARTING Component" %>
<%@ Register TagPrefix="dotnet" Namespace="dotnetCHARTING" Assembly="dotnetCHARTING"%>
<%@ Import Namespace="System.Drawing" %>
<%@ Import Namespace="System.Drawing.Drawing2D" %>
<html xmlns="http://www.w3.org/1999/xhtml">
<head>
<title>.netCHARTING Sample</title>
<script runat="server">
Sub Page_Load(ByVal sender As Object, ByVal e As EventArgs)
' Demonstrates the use of Aroon indicators.
' The Financial Chart
FinancialChart.Title="Financial Chart"
FinancialChart.TempDirectory="temp"
FinancialChart.Debug=True
FinancialChart.ShadingEffect = True
FinancialChart.LegendBox.Template ="%icon %name"
FinancialChart.Size="800X500"
FinancialChart.XAxis.Scale = Scale.Time
FinancialChart.DefaultSeries.Type = SeriesType.Spline
FinancialChart.DefaultSeries.DefaultElement.Marker.Type = ElementMarkerType.None
' For Aroon indicators the time scale is inverted (i.e. the first element of the series is the newest)
FinancialChart.XAxis.InvertScale = True
FinancialChart.YAxis.Label.Text = "Price (USD)"
FinancialChart.YAxis.FormatString = "currency"
FinancialChart.YAxis.Scale = Scale.Range
' Modify the x axis labels.
FinancialChart.XAxis.TimeInterval = TimeInterval.Week
FinancialChart.XAxis.TimeScaleLabels.Mode = TimeScaleLabelMode.Smart
FinancialChart.XAxis.TimeScaleLabels.DayFormatString = "o"
FinancialChart.XAxis.TimeScaleLabels.RangeIntervals.Add(TimeInterval.Month)
FinancialChart.XAxis.TimeScaleLabels.MonthFormatString = "MMM"
' Setup the dataEngine to get data.
Dim priceDataEngine As DataEngine = New DataEngine(ConfigurationManager.AppSettings("DNCConnectionString"))
priceDataEngine.ChartObject = FinancialChart
priceDataEngine.ChartType = ChartType.Financial
priceDataEngine.DateGrouping = TimeInterval.Day
priceDataEngine.StartDate = New DateTime (2021,6,1)
priceDataEngine.EndDate = New DateTime (2021,8,30)
' For this example we import data from the FinancialCompany table from within chartsample.mdb
priceDataEngine.SqlStatement = "SELECT TransDate, HighPrice, LowPrice, OpenPrice, ClosePrice FROM FinancialCompany WHERE TransDate >= #STARTDATE# AND TransDate <= #ENDDATE# ORDER BY TransDate Desc"
priceDataEngine.DataFields = "xAxis=TransDate,High=HighPrice,Low=LowPrice,Open=OpenPrice,Close=ClosePrice"
' Get prices from the data engine.
Dim sc As SeriesCollection = priceDataEngine.GetSeries ()
Dim prices As Series = Nothing
If sc.Count>0 Then
prices = sc(0)
Else
Return
End If
prices.DefaultElement.ShowValue=False
prices.DefaultElement.ToolTip="L:%Low-H:%High"
prices.DefaultElement.SmartLabel.Font = New Font("Arial", 6)
prices.DefaultElement.SmartLabel.Text="O:%Open-C:%Close"
prices.Type = SeriesTypeFinancial.CandleStick
' Trim out weekends from the prices series and add it to the chart.
Dim cp As CalendarPattern = New CalendarPattern (TimeInterval.Day, TimeInterval.Week, "1000001")
prices.Trim (cp, ElementValue.XDateTime)
prices.Name = "Prices"
FinancialChart.SeriesCollection.Add (prices)
' Here we create a new chart area for displaying the series for Aroon indicators.
' Aroon chart area
Dim aroonChartArea As ChartArea = New ChartArea ()
aroonChartArea.HeightPercentage = 20
' A new y axis is assigned in order to loose the original y axis' settings.
aroonChartArea.YAxis = New Axis ()
aroonChartArea.YAxis.ZeroTick.GridLine.Color = Color.FromArgb(125, 255, 0, 0)
FinancialChart.ExtraChartAreas.Add (aroonChartArea)
' AroonUpOverPeriod - measures the relative time since the last highest high over a peroid of five days.
Dim aroonUpOverPeriod As Series = FinancialEngine.AroonUpOverPeriod(prices,5)
aroonUpOverPeriod.Name = " AroonUpOverPeriod5"
aroonUpOverPeriod.DefaultElement.Color = Color.FromArgb(49,255,49)
aroonChartArea.SeriesCollection.Add (aroonUpOverPeriod)
' AroonDownOverPeriod - indicator which measures the relative time since the last lowest low over
' a period of five days.
Dim aroonDownOverPeriod As Series = FinancialEngine.AroonDownOverPeriod(prices,5)
aroonDownOverPeriod.Name = " AroonDownOverPeriod5"
aroonDownOverPeriod.DefaultElement.Color = Color.FromArgb(0,156,255)
aroonChartArea.SeriesCollection.Add (aroonDownOverPeriod)
' AroonOscillatorOverPeriod - Evaluates the Aroon Oscillator over the last 5 days which is given by the
' following formulae: Aroon Oscillator = (Aroon Up Indicator) - (Aroon DownIndicator).
Dim aroonOscillatorOverPeriod As Series = FinancialEngine.AroonOscillatorOverPeriod(prices,5)
aroonOscillatorOverPeriod.Name = " AroonOscillatorOverPeriod5"
aroonOscillatorOverPeriod.DefaultElement.Color = Color.FromArgb(255,99,49)
aroonChartArea.SeriesCollection.Add (aroonOscillatorOverPeriod)
' The Aroon indicator has been developed in order to indicate when a trending
' approach such as moving averages or the trading range approach such as the
' application of oscillators in more appropriate.
FinancialChart.SeriesCollection.Add (FinancialEngine.TriangularMovingAverage (prices, ElementValue.High, 5))
End Sub
</script>
</head>
<body>
<div style="text-align:center">
<dotnet:Chart id="FinancialChart" runat="server"/>
</div>
</body>
</html>
- Sample FilenameAroonIndicators.aspx
- VersionLegacy (Pre 3.0)
- Uses DatabaseYes