Exponential Distribution 2
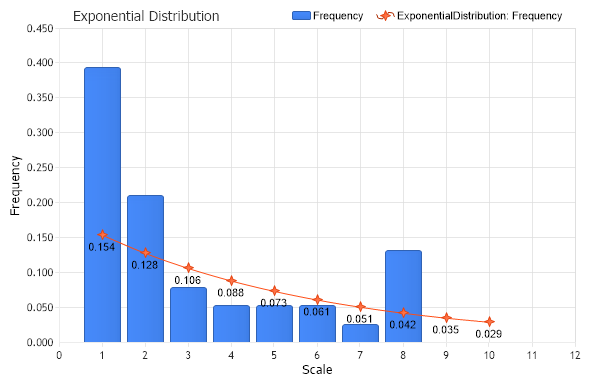
Demonstrates the use of Exponential Distribution and Relative Frequency Table for summarize quantitative data from within StatisticalEngine.
<%@ Page Language="C#" Description="dotnetCHARTING Component" %>
<%@ Register TagPrefix="dotnet" Namespace="dotnetCHARTING" Assembly="dotnetCHARTING"%>
<%@ Import Namespace="System.Drawing" %>
<%@ Import Namespace="System.Drawing.Drawing2D" %>
<%@ Import Namespace="dotnetCHARTING"%>
<html xmlns="http://www.w3.org/1999/xhtml">
<head>
<title>.netCHARTING Sample</title>
<script runat="server">
void Page_Load(Object sender,EventArgs e)
{
// Demonstrates the use of Exponential Distribution and Relative Frequency Table
// for summarize quantitative data from within StatisticalEngine.
// The Distribution Chart
DistributionChart.Title=" Exponential Distribution";
DistributionChart.TempDirectory = "temp";
DistributionChart.Debug=true;
DistributionChart.Size = "600x400";
DistributionChart.LegendBox.Template ="%icon %name";
DistributionChart.XAxis.Label.Text = "Scale";
DistributionChart.YAxis.Label.Text = "Frequency";
DistributionChart.TitleBox.Position = TitleBoxPosition.FullWithLegend;
DistributionChart.YAxis.FormatString = "n3";
DistributionChart.XAxis.Interval=1;
int[] vector = new int[] {0,1,1,1,1,1,1,1,1,1,1,1,1,1,1,2,2,2,2,2,2,2,2,3,3,3,4,4,5,5,6,6,7,8,8,8,8,8};
Series sampledata = new Series ("Sample");
for ( int i=0; i < vector.Length; i++) {
Element el = new Element();
el.YValue = vector[i];
sampledata.Elements.Add (el);
}
/*Random myR = new Random(1);
for ( int i=0; i < 1000; i++) {
Element el = new Element();
el.YValue = myR.Next(1,10);
sampledata.Elements.Add (el);
}*/
// CFrequencyTableAOL - Calculates the cumulative frequency table from above for a discrete data set
// in accordance with the open left boundary (OLB) convention.
Series ftableOL = StatisticalEngine.RFrequencyTableOL("Frequency", sampledata, new double[] {1,2,3,4,5,6,7,8,9,10});
DistributionChart.SeriesCollection.Add(ftableOL);
// The second parameter of this method is the scale parameter of the exponential probability distribution
// We use the values from ftableOL series to calculate and display the exponential probability density
// function.
Series expDistribution = StatisticalEngine.ExponentialDistribution(ftableOL,0.1);
expDistribution.Type = SeriesType.Spline;
expDistribution.DefaultElement.ShowValue = true;
expDistribution.DefaultElement.SmartLabel.Text = "%YValue";
expDistribution.DefaultElement.SmartLabel.Color = Color.Black;
DistributionChart.SeriesCollection.Add (expDistribution);
}
</script>
</head>
<body>
<div style="text-align:center">
<dotnet:Chart id="DistributionChart" runat="server"/>
</div>
</body>
</html>
<%@ Page Language="vb" Description="dotnetCHARTING Component" %>
<%@ Register TagPrefix="dotnet" Namespace="dotnetCHARTING" Assembly="dotnetCHARTING"%>
<%@ Import Namespace="System.Drawing" %>
<%@ Import Namespace="System.Drawing.Drawing2D" %>
<%@ Import Namespace="dotnetCHARTING"%>
<html xmlns="http://www.w3.org/1999/xhtml">
<head>
<title>.netCHARTING Sample</title>
<script runat="server">
Sub Page_Load(ByVal sender As Object, ByVal e As EventArgs)
' Demonstrates the use of Exponential Distribution and Relative Frequency Table
' for summarize quantitative data from within StatisticalEngine.
' The Distribution Chart
DistributionChart.Title=" Exponential Distribution"
DistributionChart.TempDirectory = "temp"
DistributionChart.Debug=True
DistributionChart.Size = "600x400"
DistributionChart.LegendBox.Template ="%icon %name"
DistributionChart.XAxis.Label.Text = "Scale"
DistributionChart.YAxis.Label.Text = "Frequency"
DistributionChart.TitleBox.Position = TitleBoxPosition.FullWithLegend
DistributionChart.YAxis.FormatString = "n3"
DistributionChart.XAxis.Interval=1
Dim vector As Integer() = New Integer() {0,1,1,1,1,1,1,1,1,1,1,1,1,1,1,2,2,2,2,2,2,2,2,3,3,3,4,4,5,5,6,6,7,8,8,8,8,8}
Dim sampledata As Series = New Series ("Sample")
For i As Integer = 0 To vector.Length - 1
Dim el As Element = New Element()
el.YValue = vector(i)
sampledata.Elements.Add (el)
Next i
'Random myR = new Random(1);
'for ( int i=0; i < 1000; i++) {
'Element el = new Element();
'el.YValue = myR.Next(1,10);
'sampledata.Elements.Add (el);
'}
' CFrequencyTableAOL - Calculates the cumulative frequency table from above for a discrete data set
' in accordance with the open left boundary (OLB) convention.
Dim ftableOL As Series = StatisticalEngine.RFrequencyTableOL("Frequency", sampledata, New Double() {1,2,3,4,5,6,7,8,9,10})
DistributionChart.SeriesCollection.Add(ftableOL)
' The second parameter of this method is the scale parameter of the exponential probability distribution
' We use the values from ftableOL series to calculate and display the exponential probability density
' function.
Dim expDistribution As Series = StatisticalEngine.ExponentialDistribution(ftableOL,0.1)
expDistribution.Type = SeriesType.Spline
expDistribution.DefaultElement.ShowValue = True
expDistribution.DefaultElement.SmartLabel.Text = "%YValue"
expDistribution.DefaultElement.SmartLabel.Color = Color.Black
DistributionChart.SeriesCollection.Add (expDistribution)
End Sub
</script>
</head>
<body>
<div style="text-align:center">
<dotnet:Chart id="DistributionChart" runat="server"/>
</div>
</body>
</html>