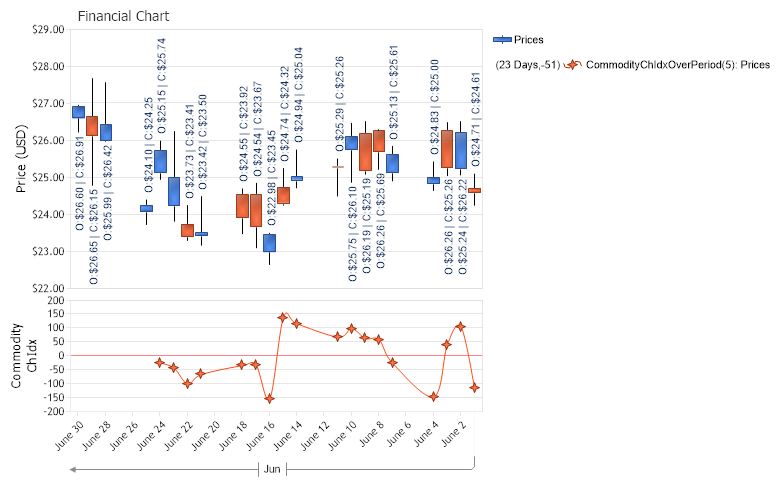
Commodity Channel Index
Demonstrates the use of financial indicator CommodityChanelIndex.
<%@ Page Language="C#" Description="dotnetCHARTING Component" %>
<%@ Register TagPrefix="dotnet" Namespace="dotnetCHARTING" Assembly="dotnetCHARTING"%>
<%@ Import Namespace="System.Drawing" %>
<%@ Import Namespace="System.Drawing.Drawing2D" %>
<html xmlns="http://www.w3.org/1999/xhtml">
<head>
<title>.netCHARTING Sample</title>
<script runat="server">
void Page_Load(Object sender,EventArgs e)
{
// Demonstrates the use of financial indicator CommodityChanelIndex
// The Financial Chart
FinancialChart.Title="Financial Chart";
FinancialChart.TempDirectory="temp";
FinancialChart.Debug=true;
FinancialChart.ShadingEffect = true;
FinancialChart.LegendBox.Template ="%icon %name";
FinancialChart.Size = "800X500";
FinancialChart.YAxis.Label.Text = "Price (USD)";
FinancialChart.YAxis.FormatString = "currency";
FinancialChart.YAxis.Scale = Scale.Range;
// For financial indicators the time scale is inverted (i.e. the first element of the series is the newest)
FinancialChart.XAxis.InvertScale = true;
// Modify the x axis labels.
FinancialChart.XAxis.Scale = Scale.Time;
FinancialChart.XAxis.TimeInterval = TimeInterval.Day;
FinancialChart.XAxis.TimeScaleLabels.DayFormatString = "o";
FinancialChart.XAxis.TimeScaleLabels.RangeIntervals.Add(TimeInterval.Month);
FinancialChart.XAxis.TimeScaleLabels.MonthFormatString = "MMM";
// Get price data
DataEngine priceDataEngine = new DataEngine(ConfigurationManager.AppSettings["DNCConnectionString"]);
priceDataEngine.ChartObject = FinancialChart;
priceDataEngine.ChartType = ChartType.Financial;
priceDataEngine.DateGrouping = TimeInterval.Day;
priceDataEngine.StartDate = new DateTime (2021,6,1);
priceDataEngine.EndDate = new DateTime (2021,6,30);
priceDataEngine.SqlStatement = @"SELECT TransDate, HighPrice, LowPrice, OpenPrice, ClosePrice FROM FinancialCompany WHERE TransDate >= #STARTDATE# AND TransDate <= #ENDDATE# ORDER BY TransDate";
priceDataEngine.DataFields = "xAxis=TransDate,High=HighPrice,Low=LowPrice,Open=OpenPrice,Close=ClosePrice";
// Get the price series and modify it.
SeriesCollection sc = priceDataEngine.GetSeries ();
Series prices = null;
if(sc.Count>0)
prices = sc[0];
else
return;
prices.Name = "Prices";
prices.DefaultElement.ShowValue=true;
prices.DefaultElement.ToolTip="L:%Low | H:%High";
prices.DefaultElement.SmartLabel.Text="O:%Open | C:%Close";
prices.Type = SeriesTypeFinancial.CandleStick;
// Trim out the weekends
CalendarPattern cp = new CalendarPattern (TimeInterval.Day, TimeInterval.Week, "0000001");
prices.Trim (cp, ElementValue.XDateTime);
FinancialChart.SeriesCollection.Add (prices);
// Create a new chart area for the commodity channel index
ChartArea indexChartArea = new ChartArea();
indexChartArea.HeightPercentage = 30;
indexChartArea.YAxis.ZeroTick.GridLine.Color = Color.FromArgb(125, 255, 0, 0);
indexChartArea.YAxis.Label.Text = "Commodity\nChIdx";
indexChartArea.DefaultSeries.Type = SeriesType.Spline;
FinancialChart.ExtraChartAreas.Add(indexChartArea);
// CommodityChannelIndexOverPeriod - Evaluates the Commodity Channel Index (CCI) developed by Donald Lambert.
indexChartArea.SeriesCollection.Add( FinancialEngine.CommodityChannelIdxOverPeriod(prices,5) );
}
</script>
</head>
<body>
<div style="text-align:center">
<dotnet:Chart id="FinancialChart" runat="server"/>
</div>
</body>
</html>
<%@ Page Language="vb" Description="dotnetCHARTING Component" %>
<%@ Register TagPrefix="dotnet" Namespace="dotnetCHARTING" Assembly="dotnetCHARTING"%>
<%@ Import Namespace="System.Drawing" %>
<%@ Import Namespace="System.Drawing.Drawing2D" %>
<html xmlns="http://www.w3.org/1999/xhtml">
<head>
<title>.netCHARTING Sample</title>
<script runat="server">
Sub Page_Load(ByVal sender As Object, ByVal e As EventArgs)
' Demonstrates the use of financial indicator CommodityChanelIndex
' The Financial Chart
FinancialChart.Title="Financial Chart"
FinancialChart.TempDirectory="temp"
FinancialChart.Debug=True
FinancialChart.ShadingEffect = True
FinancialChart.LegendBox.Template ="%icon %name"
FinancialChart.Size = "800X500"
FinancialChart.YAxis.Label.Text = "Price (USD)"
FinancialChart.YAxis.FormatString = "currency"
FinancialChart.YAxis.Scale = Scale.Range
' For financial indicators the time scale is inverted (i.e. the first element of the series is the newest)
FinancialChart.XAxis.InvertScale = True
' Modify the x axis labels.
FinancialChart.XAxis.Scale = Scale.Time
FinancialChart.XAxis.TimeInterval = TimeInterval.Day
FinancialChart.XAxis.TimeScaleLabels.DayFormatString = "o"
FinancialChart.XAxis.TimeScaleLabels.RangeIntervals.Add(TimeInterval.Month)
FinancialChart.XAxis.TimeScaleLabels.MonthFormatString = "MMM"
' Get price data
Dim priceDataEngine As DataEngine = New DataEngine(ConfigurationManager.AppSettings("DNCConnectionString"))
priceDataEngine.ChartObject = FinancialChart
priceDataEngine.ChartType = ChartType.Financial
priceDataEngine.DateGrouping = TimeInterval.Day
priceDataEngine.StartDate = New DateTime (2021,6,1)
priceDataEngine.EndDate = New DateTime (2021,6,30)
priceDataEngine.SqlStatement = "SELECT TransDate, HighPrice, LowPrice, OpenPrice, ClosePrice FROM FinancialCompany WHERE TransDate >= #STARTDATE# AND TransDate <= #ENDDATE# ORDER BY TransDate"
priceDataEngine.DataFields = "xAxis=TransDate,High=HighPrice,Low=LowPrice,Open=OpenPrice,Close=ClosePrice"
' Get the price series and modify it.
Dim sc As SeriesCollection = priceDataEngine.GetSeries ()
Dim prices As Series = Nothing
If sc.Count>0 Then
prices = sc(0)
Else
Return
End If
prices.Name = "Prices"
prices.DefaultElement.ShowValue=True
prices.DefaultElement.ToolTip="L:%Low | H:%High"
prices.DefaultElement.SmartLabel.Text="O:%Open | C:%Close"
prices.Type = SeriesTypeFinancial.CandleStick
' Trim out the weekends
Dim cp As CalendarPattern = New CalendarPattern (TimeInterval.Day, TimeInterval.Week, "0000001")
prices.Trim (cp, ElementValue.XDateTime)
FinancialChart.SeriesCollection.Add (prices)
' Create a new chart area for the commodity channel index
Dim indexChartArea As ChartArea = New ChartArea()
indexChartArea.HeightPercentage = 30
indexChartArea.YAxis.ZeroTick.GridLine.Color = Color.FromArgb(125, 255, 0, 0)
indexChartArea.YAxis.Label.Text = "Commodity" & Constants.vbLf & "ChIdx"
indexChartArea.DefaultSeries.Type = SeriesType.Spline
FinancialChart.ExtraChartAreas.Add(indexChartArea)
' CommodityChannelIndexOverPeriod - Evaluates the Commodity Channel Index (CCI) developed by Donald Lambert.
indexChartArea.SeriesCollection.Add(FinancialEngine.CommodityChannelIdxOverPeriod(prices,5))
End Sub
</script>
</head>
<body>
<div style="text-align:center">
<dotnet:Chart id="FinancialChart" runat="server"/>
</div>
</body>
</html>