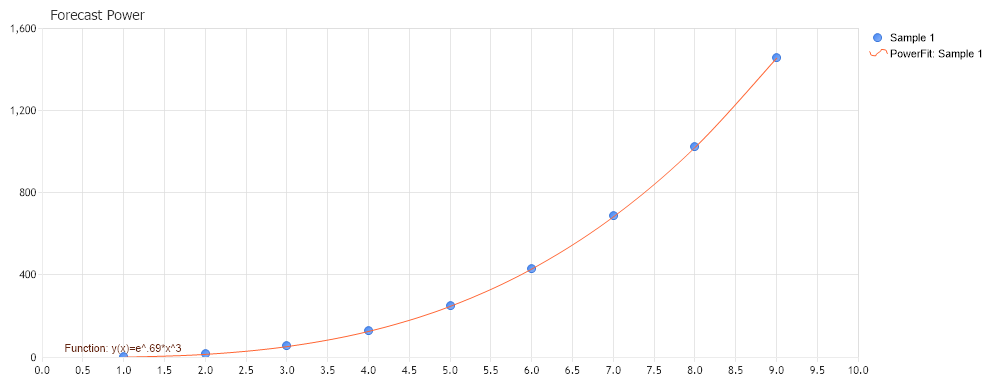
Gallery
Trend Line Power
<%@ Page Language="C#" Description="dotnetCHARTING Component" %>
<%@ Register TagPrefix="dotnet" Namespace="dotnetCHARTING" Assembly="dotnetCHARTING"%>
<%@ Import Namespace="System.Drawing" %>
<%@ Import Namespace="System.Drawing.Drawing2D" %>
<%@ Import Namespace="dotnetCHARTING"%>
<html xmlns="http://www.w3.org/1999/xhtml">
<head>
<title>.netCHARTING Forecast Sample</title>
<script runat="server">
void Page_Load(Object sender,EventArgs e)
{
// Demonstrates the use of TrendLinePower from within Forecasting
// which find the best fitting power curve to sets of data
// The Forecast Chart
ForecastChart.Title="Forecast Power";
ForecastChart.TempDirectory="temp";
ForecastChart.Debug=true;
ForecastChart.Size = "1000x400";
ForecastChart.LegendBox.Template ="%icon %name";
ForecastChart.XAxis.Scale = Scale.Normal;
SeriesCollection spower = new SeriesCollection();
Series sampledata1 = new Series ("Sample 1");
for ( int i = 1; i < 10; i++) {
Element el = new Element();
el.YValue = 2*Math.Pow(i, 3) ;
el.XValue = i ;
sampledata1.Elements.Add (el);
}
spower.Add (sampledata1);
spower[0].Type = SeriesType.Marker;
ForecastChart.SeriesCollection.Add (spower);
// Here we create a series which will hold the Y values calculated with the PowerFit indicator
Series trendLinePower = new Series();
trendLinePower = ForecastEngine.TrendLinePower(sampledata1);
//The next two lines display no to the chart the power function used
// to fit the curve
trendLinePower.Elements[0].SmartLabel.Text = "Function: %Function";
trendLinePower.Elements[0].ShowValue = true;
trendLinePower.DefaultElement.Marker = new ElementMarker (ElementMarkerType.None);
trendLinePower.DefaultElement.Color = Color.FromArgb(255,99,49);
trendLinePower.Type = SeriesType.Spline;
ForecastChart.SeriesCollection.Add(trendLinePower);
}
</script>
</head>
<body>
<div style="text-align:center">
<dotnet:Chart id="ForecastChart" runat="server"/>
</div>
</body>
</html>
<%@ Page Language="vb" Description="dotnetCHARTING Component" %>
<%@ Register TagPrefix="dotnet" Namespace="dotnetCHARTING" Assembly="dotnetCHARTING"%>
<%@ Import Namespace="System.Drawing" %>
<%@ Import Namespace="System.Drawing.Drawing2D" %>
<%@ Import Namespace="dotnetCHARTING"%>
<html xmlns="http://www.w3.org/1999/xhtml">
<head>
<title>.netCHARTING Forecast Sample</title>
<script runat="server">
Sub Page_Load(ByVal sender As Object, ByVal e As EventArgs)
' Demonstrates the use of TrendLinePower from within Forecasting
' which find the best fitting power curve to sets of data
' The Forecast Chart
ForecastChart.Title="Forecast Power"
ForecastChart.TempDirectory="temp"
ForecastChart.Debug=True
ForecastChart.Size = "1000x400"
ForecastChart.LegendBox.Template ="%icon %name"
ForecastChart.XAxis.Scale = Scale.Normal
Dim spower As SeriesCollection = New SeriesCollection()
Dim sampledata1 As Series = New Series ("Sample 1")
For i As Integer = 1 To 9
Dim el As Element = New Element()
el.YValue = 2*Math.Pow(i, 3)
el.XValue = i
sampledata1.Elements.Add (el)
Next i
spower.Add (sampledata1)
spower(0).Type = SeriesType.Marker
ForecastChart.SeriesCollection.Add (spower)
' Here we create a series which will hold the Y values calculated with the PowerFit indicator
Dim trendLinePower As Series = New Series()
trendLinePower = ForecastEngine.TrendLinePower(sampledata1)
'The next two lines display no to the chart the power function used
' to fit the curve
trendLinePower.Elements(0).SmartLabel.Text = "Function: %Function"
trendLinePower.Elements(0).ShowValue = True
trendLinePower.DefaultElement.Marker = New ElementMarker (ElementMarkerType.None)
trendLinePower.DefaultElement.Color = Color.FromArgb(255,99,49)
trendLinePower.Type = SeriesType.Spline
ForecastChart.SeriesCollection.Add(trendLinePower)
End Sub
</script>
</head>
<body>
<div style="text-align:center">
<dotnet:Chart id="ForecastChart" runat="server"/>
</div>
</body>
</html>
- Sample FilenameTrendLinePower.aspx
- VersionLegacy (Pre 3.0)
- Uses DatabaseNo