ChartArea sChartArea = new ChartArea ("S Chart"); sChartArea.XAxis = new Axis (); sChartArea.LegendBox = new LegendBox(); sChartArea.LegendBox.Visible = false; sChartArea.DefaultSeries.LegendEntry.Visible = false; Chart.ExtraChartAreas.Add (sChartArea);
Series sChart = StatisticalEngine.SChart(mySC); sChartArea.SeriesCollection.Add (sChart);
ChartArea sXBARChartArea = new ChartArea ("S XBAR"); sXBARChartArea.XAxis = new Axis ();
Chart.ExtraChartAreas.Add (sXBARChartArea); sXBARChartArea.LegendBox = new LegendBox(); sXBARChartArea.LegendBox.Visible = false;
Series sXBARChart = StatisticalEngine.SXBARChart(mySC); sXBARChartArea.SeriesCollection.Add (sXBARChart); }
SeriesCollection getRandomData() { SeriesCollection SC = new SeriesCollection(); Random myR = new Random(5); for(int a = 1; a < 6; a++) { Series s = new Series(); s.Name = "Series " + a; for(int b = 1; b < 6; b++) { Element e = new Element(); e.Name = "Element " + b; e.YValue = myR.Next(50); s.Elements.Add(e); } SC.Add(s); }
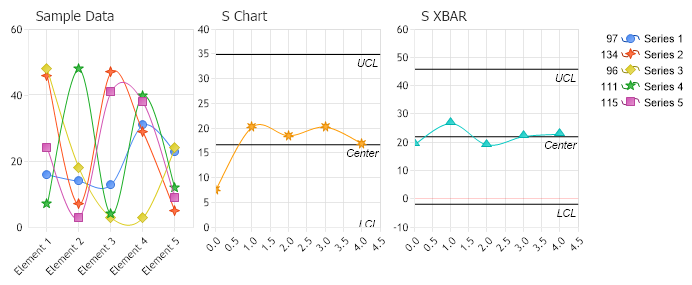
Sub Page_Load(ByVal sender As Object, ByVal e As EventArgs) Chart.Type = ChartType.Combo Chart.Width = 700 Chart.Height = 300 Chart.TempDirectory = "temp" Chart.Debug = True Chart.Title = "Sample Data"
Dim mySC As SeriesCollection = getRandomData() Chart.SeriesCollection.Add(mySC) Chart.DefaultSeries.Type = SeriesType.Spline Chart.ChartAreaLayout.Mode = ChartAreaLayoutMode.Horizontal
Dim sChartArea As ChartArea = New ChartArea ("S Chart") sChartArea.XAxis = New Axis () sChartArea.LegendBox = New LegendBox() sChartArea.LegendBox.Visible = False sChartArea.DefaultSeries.LegendEntry.Visible = False Chart.ExtraChartAreas.Add (sChartArea)
Dim sChart As Series = StatisticalEngine.SChart(mySC) sChartArea.SeriesCollection.Add (sChart)
Dim sXBARChartArea As ChartArea = New ChartArea ("S XBAR") sXBARChartArea.XAxis = New Axis ()
Chart.ExtraChartAreas.Add (sXBARChartArea) sXBARChartArea.LegendBox = New LegendBox() sXBARChartArea.LegendBox.Visible = False
Dim sXBARChart As Series = StatisticalEngine.SXBARChart(mySC) sXBARChartArea.SeriesCollection.Add (sXBARChart) End Sub
Function getRandomData() As SeriesCollection Dim SC As SeriesCollection = New SeriesCollection() Dim myR As Random = New Random(5) For a As Integer = 1 To 5 Dim s As Series = New Series() s.Name = "Series " & a For b As Integer = 1 To 5 Dim e As Element = New Element() e.Name = "Element " & b e.YValue = myR.Next(50) s.Elements.Add(e) Next b SC.Add(s) Next a
Return SC End Function </script> </head> <body> <div style="text-align:center"> <dotnet:Chart id="Chart" runat="server" Width="568px" Height="344px"> </dotnet:Chart> </div> </body> </html>