DMISignal
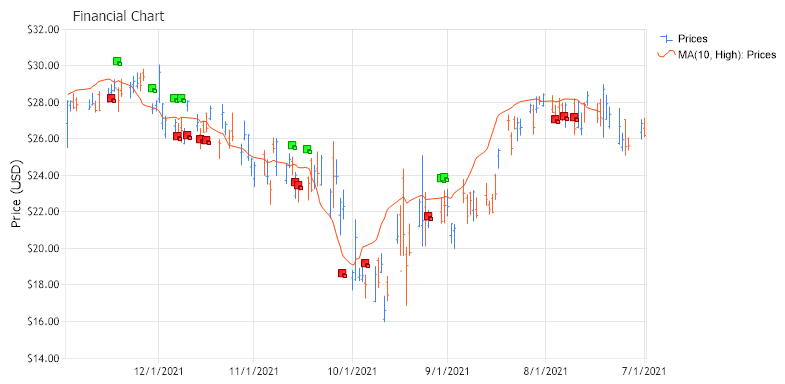
Demonstrates the use of the DMI Signal indicator.
<%@ Page Language="C#" Description="dotnetCHARTING Component" %>
<%@ Register TagPrefix="dotnet" Namespace="dotnetCHARTING" Assembly="dotnetCHARTING"%>
<%@ Import Namespace="System.Drawing" %>
<%@ Import Namespace="dotnetCHARTING"%>
<html xmlns="http://www.w3.org/1999/xhtml">
<head>
<title>.netCHARTING Financial DMI Signal Sample</title>
<script runat="server">
void Page_Load(Object sender,EventArgs e)
{
// Demonstrates the use of the DMI Signal indicator
// First we declare a chart of type FinancialChart
// The Financial Chart
FinancialChart.Title="Financial Chart";
FinancialChart.TempDirectory="temp";
FinancialChart.Debug=true;
FinancialChart.ShadingEffect = true;
FinancialChart.LegendBox.Template ="%icon %name";
FinancialChart.Size="800X400";
FinancialChart.XAxis.Scale = Scale.Time;
FinancialChart.XAxis.FormatString = "d";
FinancialChart.YAxis.Interval = 2;
// For financial indicators the time scale is inverted (i.e. the first element of the series is the newest)
FinancialChart.XAxis.InvertScale = true;
//FinancialChart.XAxis.TimeInterval = TimeInterval.Day;
FinancialChart.YAxis.Label.Text = "Price (USD)";
FinancialChart.YAxis.FormatString = "currency";
FinancialChart.YAxis.Scale = Scale.Range;
FinancialChart.YAxis.ScaleRange.ValueLow = 14.00;
FinancialChart.YAxis.ScaleRange.ValueHigh = 32.00;
// Here we load data samples from the FinancialCompany table from within chartsample.mdb
DataEngine priceDataEngine = new DataEngine ();
priceDataEngine.ChartType = ChartType.Financial;
priceDataEngine.ConnectionString = ConfigurationManager.AppSettings["DNCConnectionString"];
priceDataEngine.DateGrouping = TimeInterval.Day;
priceDataEngine.StartDate = new DateTime (2021,7,1);
priceDataEngine.EndDate = new DateTime (2021,12,30);
priceDataEngine.SqlStatement = @"SELECT TransDate, HighPrice, LowPrice, OpenPrice, ClosePrice FROM FinancialCompany WHERE TransDate >= #STARTDATE# AND TransDate <= #ENDDATE# ORDER BY TransDate ";
priceDataEngine.DataFields = "xAxis=TransDate,High=HighPrice,Low=LowPrice,Open=OpenPrice,Close=ClosePrice";
SeriesCollection sc = priceDataEngine.GetSeries ();
Series prices = null;
if(sc.Count>0)
prices = sc[0];
else
return;
prices.DefaultElement.ToolTip="L:%Low-H:%High";
prices.DefaultElement.SmartLabel.Font = new Font("Arial", 6);
prices.DefaultElement.SmartLabel.Text="O:%Open-C:%Close";
prices.Type = SeriesTypeFinancial.Bar;
CalendarPattern cp = new CalendarPattern (TimeInterval.Day, TimeInterval.Week, "0000001");
cp.AdjustmentUnit = TimeInterval.Day;
prices.Trim (cp, ElementValue.XDateTime);
prices.Name = "Prices";
FinancialChart.SeriesCollection.Add (prices);
// Financial Series DMI Signal
FinancialChart.DefaultSeries.DefaultElement.Marker = new ElementMarker (ElementMarkerType.None);
FinancialChart.ChartAreaLayout.Mode = ChartAreaLayoutMode.Vertical;
FinancialChart.DefaultSeries.Type = SeriesType.Spline;
// Here we display the financial simple moving average for the prices series over five days
Series movingAverage = FinancialEngine.SimpleMovingAverage (prices, ElementValue.High, 10);
FinancialChart.SeriesCollection.Add (movingAverage);
// Here we display the DMI Signal. For calcualting the DMI Signal we are using the
// Simple Moving Average method(method =1) over a period of 10 days.
Series dmiSignal = FinancialEngine.DMISignal (prices, 1, 10);
dmiSignal.Type = SeriesType.Marker;
dmiSignal.LegendEntry.Visible = false;
if (dmiSignal.Elements.Count > 0)
// We add the movingAverage series to dmiSignal in order to represents
// dmiSignal on to the FinancialChart. We did this because the YValues of the
// dmiSignal take the values of: 1, 0, or -1 representing a buy, no action or sell
// signal.
FinancialChart.SeriesCollection.Add (dmiSignal + movingAverage);
else Console.WriteLine ("The series dmiSignal is empty");
}
</script>
</head>
<body>
<div style="text-align:center">
<dotnet:Chart id="FinancialChart" runat="server"/>
</div>
</body>
</html>
<%@ Page Language="vb" Description="dotnetCHARTING Component" %>
<%@ Register TagPrefix="dotnet" Namespace="dotnetCHARTING" Assembly="dotnetCHARTING"%>
<%@ Import Namespace="System.Drawing" %>
<%@ Import Namespace="dotnetCHARTING"%>
<html xmlns="http://www.w3.org/1999/xhtml">
<head>
<title>.netCHARTING Financial DMI Signal Sample</title>
<script runat="server">
Sub Page_Load(ByVal sender As Object, ByVal e As EventArgs)
' Demonstrates the use of the DMI Signal indicator
' First we declare a chart of type FinancialChart
' The Financial Chart
FinancialChart.Title="Financial Chart"
FinancialChart.TempDirectory="temp"
FinancialChart.Debug=True
FinancialChart.ShadingEffect = True
FinancialChart.LegendBox.Template ="%icon %name"
FinancialChart.Size="800X400"
FinancialChart.XAxis.Scale = Scale.Time
FinancialChart.XAxis.FormatString = "d"
FinancialChart.YAxis.Interval = 2
' For financial indicators the time scale is inverted (i.e. the first element of the series is the newest)
FinancialChart.XAxis.InvertScale = True
'FinancialChart.XAxis.TimeInterval = TimeInterval.Day;
FinancialChart.YAxis.Label.Text = "Price (USD)"
FinancialChart.YAxis.FormatString = "currency"
FinancialChart.YAxis.Scale = Scale.Range
FinancialChart.YAxis.ScaleRange.ValueLow = 14.00
FinancialChart.YAxis.ScaleRange.ValueHigh = 32.00
' Here we load data samples from the FinancialCompany table from within chartsample.mdb
Dim priceDataEngine As DataEngine = New DataEngine ()
priceDataEngine.ChartType = ChartType.Financial
priceDataEngine.ConnectionString = ConfigurationManager.AppSettings("DNCConnectionString")
priceDataEngine.DateGrouping = TimeInterval.Day
priceDataEngine.StartDate = New DateTime (2021,7,1)
priceDataEngine.EndDate = New DateTime (2021,12,30)
priceDataEngine.SqlStatement = "SELECT TransDate, HighPrice, LowPrice, OpenPrice, ClosePrice FROM FinancialCompany WHERE TransDate >= #STARTDATE# AND TransDate <= #ENDDATE# ORDER BY TransDate "
priceDataEngine.DataFields = "xAxis=TransDate,High=HighPrice,Low=LowPrice,Open=OpenPrice,Close=ClosePrice"
Dim sc As SeriesCollection = priceDataEngine.GetSeries ()
Dim prices As Series = Nothing
If sc.Count>0 Then
prices = sc(0)
Else
Return
End If
prices.DefaultElement.ToolTip="L:%Low-H:%High"
prices.DefaultElement.SmartLabel.Font = New Font("Arial", 6)
prices.DefaultElement.SmartLabel.Text="O:%Open-C:%Close"
prices.Type = SeriesTypeFinancial.Bar
Dim cp As CalendarPattern = New CalendarPattern (TimeInterval.Day, TimeInterval.Week, "0000001")
cp.AdjustmentUnit = TimeInterval.Day
prices.Trim (cp, ElementValue.XDateTime)
prices.Name = "Prices"
FinancialChart.SeriesCollection.Add (prices)
' Financial Series DMI Signal
FinancialChart.DefaultSeries.DefaultElement.Marker = New ElementMarker (ElementMarkerType.None)
FinancialChart.ChartAreaLayout.Mode = ChartAreaLayoutMode.Vertical
FinancialChart.DefaultSeries.Type = SeriesType.Spline
' Here we display the financial simple moving average for the prices series over five days
Dim movingAverage As Series = FinancialEngine.SimpleMovingAverage (prices, ElementValue.High, 10)
FinancialChart.SeriesCollection.Add (movingAverage)
' Here we display the DMI Signal. For calcualting the DMI Signal we are using the
' Simple Moving Average method(method =1) over a period of 10 days.
Dim dmiSignal As Series = FinancialEngine.DMISignal (prices, 1, 10)
dmiSignal.Type = SeriesType.Marker
dmiSignal.LegendEntry.Visible = False
If dmiSignal.Elements.Count > 0 Then
' We add the movingAverage series to dmiSignal in order to represents
' dmiSignal on to the FinancialChart. We did this because the YValues of the
' dmiSignal take the values of: 1, 0, or -1 representing a buy, no action or sell
' signal.
FinancialChart.SeriesCollection.Add (dmiSignal + movingAverage)
Else
Console.WriteLine ("The series dmiSignal is empty")
End If
End Sub
</script>
</head>
<body>
<div style="text-align:center">
<dotnet:Chart id="FinancialChart" runat="server"/>
</div>
</body>
</html>