// Demonstrates how to derive trend lines from your data.
// First we get our data, if you would like to get the data from a database you need to use // the data engine. See sample: features/dataEngine.aspx. Or the dataEngine tutorial in the help file. SeriesCollection mySC = getRandomData();
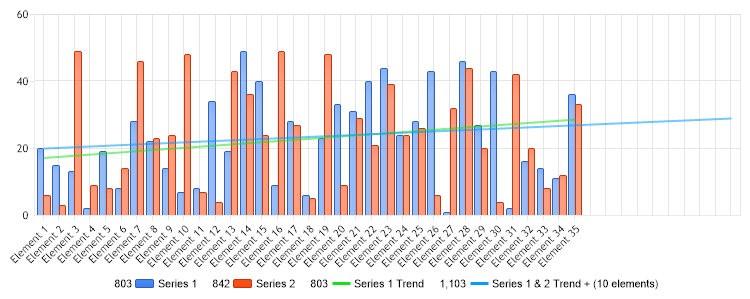
// Get a trend line from series 1. Because only the SeriesCollection Calculate method returns a series a // SeriesCollection is instantiated and the method is used. Series trend1 = (new SeriesCollection(mySC[0])).Calculate("Series 1 Trend",Calculation.TrendLineLinear);
// Set the type to line trend1.Type = SeriesType.Line;
//We'll give this line a green color so it looks like the related green columns of series 2. trend1.DefaultElement.Color = Color.FromArgb(25,225,25);
// Trend line from Series 1 & 2 // This time we want to predict what will happen 10 steps from now so we pass an extra parameter to the // calculate method. Series trend2 = mySC.Calculate("Series 1 & 2 Trend + (10 elements)",Calculation.TrendLineLinear,10);
// Set the series type to line trend2.Type = SeriesType.Line;
// Give this trend line a blue color. trend2.DefaultElement.Color = Color.FromArgb(0,156,255);
// Add the trend lines to the collection. mySC.Add(trend1); mySC.Add(trend2);
// Add the collection. Chart.SeriesCollection.Add(mySC);
}
SeriesCollection getRandomData() { SeriesCollection SC = new SeriesCollection(); Random myR = new Random(); for(int a = 1; a < 3; a++) { Series s = new Series(); s.Name = "Series " + a; for(int b = 1; b < 36; b++) { Element e = new Element(); e.Name = "Element " + b; if(a == 0) e.YValue = myR.Next(30); else e.YValue = myR.Next(50); s.Elements.Add(e); } SC.Add(s); } return SC; } </script> </head> <body> <div style="text-align:center"> <dotnet:Chart id="Chart" runat="server" Width="568px" Height="344px"> </dotnet:Chart> </div> </body> </html>
' Demonstrates how to derive trend lines from your data.
' First we get our data, if you would like to get the data from a database you need to use ' the data engine. See sample: features/dataEngine.aspx. Or the dataEngine tutorial in the help file. Dim mySC As SeriesCollection = getRandomData()
' Get a trend line from series 1. Because only the SeriesCollection Calculate method returns a series a ' SeriesCollection is instantiated and the method is used. Dim trend1 As Series = (New SeriesCollection(mySC(0))).Calculate("Series 1 Trend",Calculation.TrendLineLinear)
' Set the type to line trend1.Type = SeriesType.Line
'We'll give this line a green color so it looks like the related green columns of series 2. trend1.DefaultElement.Color = Color.FromArgb(25,225,25)
' Trend line from Series 1 & 2 ' This time we want to predict what will happen 10 steps from now so we pass an extra parameter to the ' calculate method. Dim trend2 As Series = mySC.Calculate("Series 1 & 2 Trend + (10 elements)",Calculation.TrendLineLinear,10)
' Set the series type to line trend2.Type = SeriesType.Line
' Give this trend line a blue color. trend2.DefaultElement.Color = Color.FromArgb(0,156,255)
' Add the trend lines to the collection. mySC.Add(trend1) mySC.Add(trend2)
' Add the collection. Chart.SeriesCollection.Add(mySC)
End Sub
Function getRandomData() As SeriesCollection Dim SC As SeriesCollection = New SeriesCollection() Dim myR As Random = New Random() For a As Integer = 1 To 2 Dim s As Series = New Series() s.Name = "Series " & a For b As Integer = 1 To 35 Dim e As Element = New Element() e.Name = "Element " & b If a = 0 Then e.YValue = myR.Next(30) Else e.YValue = myR.Next(50) End If s.Elements.Add(e) Next b SC.Add(s) Next a Return SC End Function </script> </head> <body> <div style="text-align:center"> <dotnet:Chart id="Chart" runat="server" Width="568px" Height="344px"> </dotnet:Chart> </div> </body> </html>