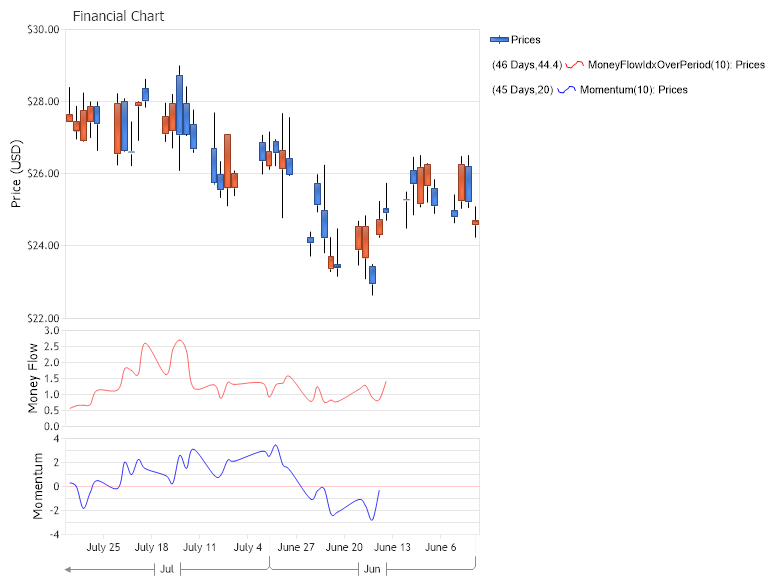
Oscillators
Demonstrates the use of financial indicators : Momentum and MoneyFlowIndexOverPeriod.
<%@ Page Language="C#" Description="dotnetCHARTING Component" %>
<%@ Register TagPrefix="dotnet" Namespace="dotnetCHARTING" Assembly="dotnetCHARTING"%>
<%@ Import Namespace="System.Drawing" %>
<%@ Import Namespace="System.Drawing.Drawing2D" %>
<html xmlns="http://www.w3.org/1999/xhtml">
<head>
<title>.netCHARTING Sample</title>
<script runat="server">
void Page_Load(Object sender,EventArgs e)
{
// Demonstrates the use of financial indicators : Momentum and MoneyFlowIndexOverPeriod
// The Financial Chart
FinancialChart.Title="Financial Chart";
FinancialChart.TempDirectory="temp";
FinancialChart.Debug=true;
FinancialChart.ShadingEffect = true;
FinancialChart.LegendBox.Template ="%icon %name";
FinancialChart.Size="800X600";
//FinancialChart.TitleBox.Position = TitleBoxPosition.FullWithLegend;
FinancialChart.DefaultElement.Marker.Visible = false;
// For financial indicators the time scale is inverted (i.e. the first element of the series is the newest)
FinancialChart.XAxis.InvertScale = true;
FinancialChart.YAxis.Label.Text = "Price (USD)";
FinancialChart.YAxis.FormatString = "currency";
FinancialChart.YAxis.Scale = Scale.Range;
// Modify the x axis labels.
FinancialChart.XAxis.Scale = Scale.Time;
FinancialChart.XAxis.TimeInterval = TimeInterval.Week;
FinancialChart.XAxis.TimeScaleLabels.DayFormatString = "o";
FinancialChart.XAxis.TimeScaleLabels.RangeIntervals.Add(TimeInterval.Month);
FinancialChart.XAxis.TimeScaleLabels.MonthFormatString = "MMM";
DataEngine priceDataEngine = new DataEngine ();
priceDataEngine.ChartObject = FinancialChart;
priceDataEngine.ChartType = ChartType.Financial;
priceDataEngine.ConnectionString = ConfigurationManager.AppSettings["DNCConnectionString"];
priceDataEngine.DateGrouping = TimeInterval.Day;
priceDataEngine.StartDate = new DateTime (2021,6,1);
priceDataEngine.EndDate = new DateTime (2021,7,30);
// Here we import data from the FinancialCompany table from within chartsample.mdb
priceDataEngine.SqlStatement = @"SELECT TransDate, HighPrice, LowPrice, OpenPrice, ClosePrice, Volume FROM FinancialCompany WHERE TransDate >= #STARTDATE# AND TransDate <= #ENDDATE# ORDER BY TransDate Desc";
priceDataEngine.DataFields = "xAxis=TransDate,High=HighPrice,Low=LowPrice,Open=OpenPrice,Close=ClosePrice,Volume=Volume";
SeriesCollection sc = priceDataEngine.GetSeries ();
Series prices = null;
if(sc.Count>0)
prices = sc[0];
else
return;
prices.Name = "Prices";
prices.DefaultElement.ToolTip="L:%Low | H:%High";
prices.Type = SeriesTypeFinancial.CandleStick;
CalendarPattern cp = new CalendarPattern (TimeInterval.Day, TimeInterval.Week, "0000001");
prices.Trim (cp, ElementValue.XDateTime);
FinancialChart.SeriesCollection.Add (prices);
// Take off the marker
// Money flow chart area
ChartArea moneyFlowChartArea = new ChartArea ();
moneyFlowChartArea.HeightPercentage = 20;
moneyFlowChartArea.YAxis.Label.Text = "Money Flow";
FinancialChart.ExtraChartAreas.Add (moneyFlowChartArea);
// MoneyFlowIndexOverPeriod - <P>Evaluates the Money Flow Index (MFI) measures the strength of money flowing
// in and out of a security over a given period.
Series moneyFlowOverPeriod = FinancialEngine.MoneyFlowIdxOverPeriod(prices,10);
moneyFlowOverPeriod.Type = SeriesType.Spline;
moneyFlowOverPeriod.DefaultElement.Color = Color.FromArgb(150,Color.Red);
moneyFlowChartArea.SeriesCollection.Add (moneyFlowOverPeriod);
// Momentum chart area
ChartArea momentumChartArea = new ChartArea ();
momentumChartArea.HeightPercentage = 20;
momentumChartArea.YAxis.Label.Text = "Momentum";
FinancialChart.ExtraChartAreas.Add (momentumChartArea);
// Momentum - We evaluate the 10-day momentum which is simply the difference between today's
// closing price and the close price 10 days ago.
Series momentum = FinancialEngine.Momentum(prices,10);
momentum.Type = SeriesType.Spline;
momentum.DefaultElement.Color = Color.FromArgb(200,Color.Blue);
momentumChartArea.SeriesCollection.Add(momentum);
}
</script>
</head>
<body>
<div style="text-align:center">
<dotnet:Chart id="FinancialChart" runat="server"/>
</div>
</body>
</html>
<%@ Page Language="vb" Description="dotnetCHARTING Component" %>
<%@ Register TagPrefix="dotnet" Namespace="dotnetCHARTING" Assembly="dotnetCHARTING"%>
<%@ Import Namespace="System.Drawing" %>
<%@ Import Namespace="System.Drawing.Drawing2D" %>
<html xmlns="http://www.w3.org/1999/xhtml">
<head>
<title>.netCHARTING Sample</title>
<script runat="server">
Sub Page_Load(ByVal sender As Object, ByVal e As EventArgs)
' Demonstrates the use of financial indicators : Momentum and MoneyFlowIndexOverPeriod
' The Financial Chart
FinancialChart.Title="Financial Chart"
FinancialChart.TempDirectory="temp"
FinancialChart.Debug=True
FinancialChart.ShadingEffect = True
FinancialChart.LegendBox.Template ="%icon %name"
FinancialChart.Size="800X600"
'FinancialChart.TitleBox.Position = TitleBoxPosition.FullWithLegend;
FinancialChart.DefaultElement.Marker.Visible = False
' For financial indicators the time scale is inverted (i.e. the first element of the series is the newest)
FinancialChart.XAxis.InvertScale = True
FinancialChart.YAxis.Label.Text = "Price (USD)"
FinancialChart.YAxis.FormatString = "currency"
FinancialChart.YAxis.Scale = Scale.Range
' Modify the x axis labels.
FinancialChart.XAxis.Scale = Scale.Time
FinancialChart.XAxis.TimeInterval = TimeInterval.Week
FinancialChart.XAxis.TimeScaleLabels.DayFormatString = "o"
FinancialChart.XAxis.TimeScaleLabels.RangeIntervals.Add(TimeInterval.Month)
FinancialChart.XAxis.TimeScaleLabels.MonthFormatString = "MMM"
Dim priceDataEngine As DataEngine = New DataEngine ()
priceDataEngine.ChartObject = FinancialChart
priceDataEngine.ChartType = ChartType.Financial
priceDataEngine.ConnectionString = ConfigurationManager.AppSettings("DNCConnectionString")
priceDataEngine.DateGrouping = TimeInterval.Day
priceDataEngine.StartDate = New DateTime (2021,6,1)
priceDataEngine.EndDate = New DateTime (2021,7,30)
' Here we import data from the FinancialCompany table from within chartsample.mdb
priceDataEngine.SqlStatement = "SELECT TransDate, HighPrice, LowPrice, OpenPrice, ClosePrice, Volume FROM FinancialCompany WHERE TransDate >= #STARTDATE# AND TransDate <= #ENDDATE# ORDER BY TransDate Desc"
priceDataEngine.DataFields = "xAxis=TransDate,High=HighPrice,Low=LowPrice,Open=OpenPrice,Close=ClosePrice,Volume=Volume"
Dim sc As SeriesCollection = priceDataEngine.GetSeries ()
Dim prices As Series = Nothing
If sc.Count>0 Then
prices = sc(0)
Else
Return
End If
prices.Name = "Prices"
prices.DefaultElement.ToolTip="L:%Low | H:%High"
prices.Type = SeriesTypeFinancial.CandleStick
Dim cp As CalendarPattern = New CalendarPattern (TimeInterval.Day, TimeInterval.Week, "0000001")
prices.Trim (cp, ElementValue.XDateTime)
FinancialChart.SeriesCollection.Add (prices)
' Take off the marker
' Money flow chart area
Dim moneyFlowChartArea As ChartArea = New ChartArea ()
moneyFlowChartArea.HeightPercentage = 20
moneyFlowChartArea.YAxis.Label.Text = "Money Flow"
FinancialChart.ExtraChartAreas.Add (moneyFlowChartArea)
' MoneyFlowIndexOverPeriod - <P>Evaluates the Money Flow Index (MFI) measures the strength of money flowing
' in and out of a security over a given period.
Dim moneyFlowOverPeriod As Series = FinancialEngine.MoneyFlowIdxOverPeriod(prices,10)
moneyFlowOverPeriod.Type = SeriesType.Spline
moneyFlowOverPeriod.DefaultElement.Color = Color.FromArgb(150,Color.Red)
moneyFlowChartArea.SeriesCollection.Add (moneyFlowOverPeriod)
' Momentum chart area
Dim momentumChartArea As ChartArea = New ChartArea ()
momentumChartArea.HeightPercentage = 20
momentumChartArea.YAxis.Label.Text = "Momentum"
FinancialChart.ExtraChartAreas.Add (momentumChartArea)
' Momentum - We evaluate the 10-day momentum which is simply the difference between today's
' closing price and the close price 10 days ago.
Dim momentum As Series = FinancialEngine.Momentum(prices,10)
momentum.Type = SeriesType.Spline
momentum.DefaultElement.Color = Color.FromArgb(200,Color.Blue)
momentumChartArea.SeriesCollection.Add(momentum)
End Sub
</script>
</head>
<body>
<div style="text-align:center">
<dotnet:Chart id="FinancialChart" runat="server"/>
</div>
</body>
</html>