Gallery
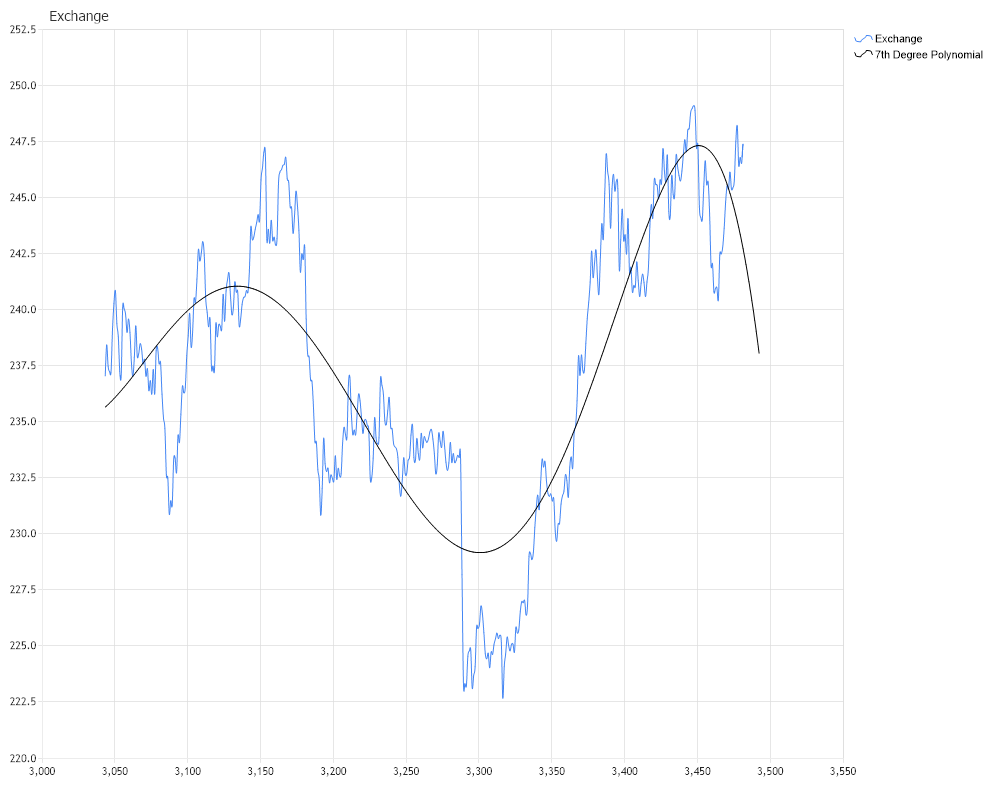
Trend Line Polynomial Ext
<%@ Page Language="C#" Description="dotnetCHARTING Component" %>
<%@ Register TagPrefix="dotnet" Namespace="dotnetCHARTING" Assembly="dotnetCHARTING"%>
<%@ Import Namespace="System.Drawing" %>
<%@ Import Namespace="System.Drawing.Drawing2D" %>
<%@ Import Namespace="dotnetCHARTING"%>
<html xmlns="http://www.w3.org/1999/xhtml">
<head>
<title>.netCHARTING Forecasting Sample</title>
<script runat="server">
void Page_Load(Object sender,EventArgs e)
{
// Demonstrates the use of TrendLine Forecasting engine in order to
// find the function of best fit for the seventh degree polynomial. The data used for which
// the fuction are fit is a set of data which represents a FX exchange rate over a given
// period of time.
// The Forecast Chart
ForecastChart.Title="Exchange";
ForecastChart.TempDirectory="temp";
ForecastChart.Debug=true;
ForecastChart.Size = "1000x800";
ForecastChart.LegendBox.Template ="%icon %name";
ForecastChart.XAxis.ScaleRange.ValueLow = 3000;
ForecastChart.YAxis.ScaleRange.ValueLow = 220;
//
// The following line allows the source data from which the curve of best fits are
// calibrated to be plotted with curve of best fit and for the x-axis values to be
// syncronized.
//
ForecastChart.XAxis.Scale = Scale.Normal;
// The Forecast data
DataEngine de = new DataEngine ();
de.ConnectionString = ConfigurationManager.AppSettings["DNCConnectionString"];
de.DateGrouping = TimeInterval.Days;
de.StartDate = new DateTime(1983,3,10,0,0,0);
de.EndDate = new DateTime(1984,12,10,23,59,59);
de.SqlStatement= @"SELECT ID, Value AS q FROM Exchange WHERE Data >= #STARTDATE# AND Data <= #ENDDATE# ORDER BY Data ";
//Add a series
SeriesCollection scForecast = de.GetSeries ();
ForecastChart.SeriesCollection.Add (scForecast);
scForecast[0].Name = "Exchange";
scForecast[0].Type = SeriesType.Spline;
/*
* Takes off the marker off the line and spline series.
*/
ForecastChart.DefaultSeries.DefaultElement.Marker = new ElementMarker (ElementMarkerType.None);
ForecastChart.ChartAreaLayout.Mode = ChartAreaLayoutMode.Vertical;
// We generate the best fitting curve of a 7th degree polynomial.
// Also we will forecast the valuse the next ten periods
// We set the distance between to values on the X axis to be 1
Series trendLineExt = new Series();
trendLineExt = ForecastEngine.TrendLinePolynomial(scForecast[0], 7,1,10,0);
trendLineExt.Name = "7th Degree Polynomial";
trendLineExt.Type = SeriesType.Spline;
ForecastChart.SeriesCollection.Add(trendLineExt);
}
</script>
</head>
<body>
<div style="text-align:center">
<dotnet:Chart id="ForecastChart" runat="server"/>
</div>
</body>
</html>
<%@ Page Language="vb" Description="dotnetCHARTING Component" %>
<%@ Register TagPrefix="dotnet" Namespace="dotnetCHARTING" Assembly="dotnetCHARTING"%>
<%@ Import Namespace="System.Drawing" %>
<%@ Import Namespace="System.Drawing.Drawing2D" %>
<%@ Import Namespace="dotnetCHARTING"%>
<html xmlns="http://www.w3.org/1999/xhtml">
<head>
<title>.netCHARTING Forecasting Sample</title>
<script runat="server">
Sub Page_Load(ByVal sender As Object, ByVal e As EventArgs)
' Demonstrates the use of TrendLine Forecasting engine in order to
' find the function of best fit for the seventh degree polynomial. The data used for which
' the fuction are fit is a set of data which represents a FX exchange rate over a given
' period of time.
' The Forecast Chart
ForecastChart.Title="Exchange"
ForecastChart.TempDirectory="temp"
ForecastChart.Debug=True
ForecastChart.Size = "1000x800"
ForecastChart.LegendBox.Template ="%icon %name"
ForecastChart.XAxis.ScaleRange.ValueLow = 3000
ForecastChart.YAxis.ScaleRange.ValueLow = 220
'
' The following line allows the source data from which the curve of best fits are
' calibrated to be plotted with curve of best fit and for the x-axis values to be
' syncronized.
'
ForecastChart.XAxis.Scale = Scale.Normal
' The Forecast data
Dim de As DataEngine = New DataEngine ()
de.ConnectionString = ConfigurationManager.AppSettings("DNCConnectionString")
de.DateGrouping = TimeInterval.Days
de.StartDate = New DateTime(1983,3,10,0,0,0)
de.EndDate = New DateTime(1984,12,10,23,59,59)
de.SqlStatement= "SELECT ID, Value AS q FROM Exchange WHERE Data >= #STARTDATE# AND Data <= #ENDDATE# ORDER BY Data "
'Add a series
Dim scForecast As SeriesCollection = de.GetSeries ()
ForecastChart.SeriesCollection.Add (scForecast)
scForecast(0).Name = "Exchange"
scForecast(0).Type = SeriesType.Spline
'
'* Takes off the marker off the line and spline series.
'
ForecastChart.DefaultSeries.DefaultElement.Marker = New ElementMarker (ElementMarkerType.None)
ForecastChart.ChartAreaLayout.Mode = ChartAreaLayoutMode.Vertical
' We generate the best fitting curve of a 7th degree polynomial.
' Also we will forecast the valuse the next ten periods
' We set the distance between to values on the X axis to be 1
Dim trendLineExt As Series = New Series()
trendLineExt = ForecastEngine.TrendLinePolynomial(scForecast(0), 7,1,10,0)
trendLineExt.Name = "7th Degree Polynomial"
trendLineExt.Type = SeriesType.Spline
ForecastChart.SeriesCollection.Add(trendLineExt)
End Sub
</script>
</head>
<body>
<div style="text-align:center">
<dotnet:Chart id="ForecastChart" runat="server"/>
</div>
</body>
</html>
- Sample FilenameTrendLinePolynomialExt.aspx
- VersionLegacy (Pre 3.0)
- Uses DatabaseYes