Gallery
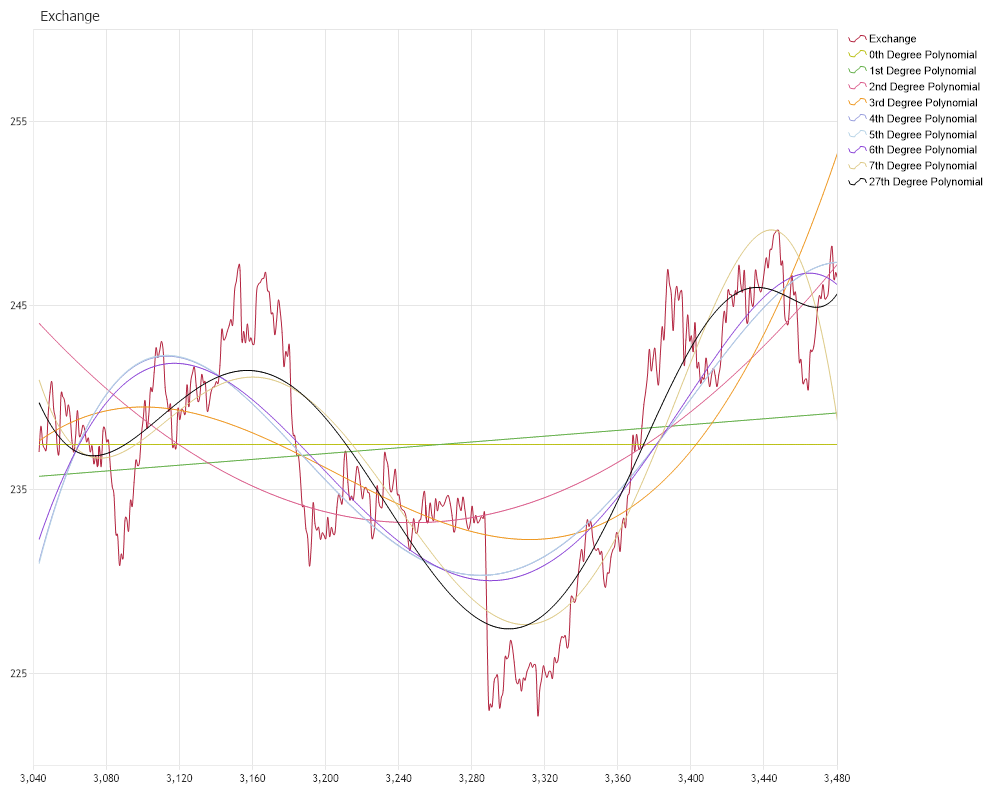
Polynomial Fitting
<%@ Page Language="C#" Description="dotnetCHARTING Component" %>
<%@ Register TagPrefix="dotnet" Namespace="dotnetCHARTING" Assembly="dotnetCHARTING"%>
<%@ Import Namespace="System.Drawing" %>
<%@ Import Namespace="System.Drawing.Drawing2D" %>
<%@ Import Namespace="dotnetCHARTING"%>
<html xmlns="http://www.w3.org/1999/xhtml">
<head>
<title>.netCHARTING Forecasting Sample</title>
<script runat="server">
void Page_Load(Object sender,EventArgs e)
{
// Demonstrates the use of GeneralLinear Forecasting engine in order to
// find the function of best fit from three functions spaces. The data used for which
// the fuctions are fit is a set of data which represents a FX exchange rate over a given
// period of time. We index the period by the number of days after the inital date and the
// eights function spaces are the spaces spanned by the following basis elements:
//
// 1) {(1)}
// 2) {(1), (x)}
// 3) {(1), (x), (x^2)}
// 4) {(1), (x), (x^2), (x^3)}
// 5) {(1), (x), (x^2), (x^3), (x^4)}
// 6) {(1), (x), (x^2), (x^3), (x^4), (x^5)}
// 7) {(1), (x), (x^2), (x^3), (x^4), (x^5), (x^6)}
// 8) {(1), (x), (x^2), (x^3), (x^4), (x^5), (x^6), (x^7)}
//
// The Forecast Chart
ForecastChart.Title="Exchange";
ForecastChart.TempDirectory="temp";
ForecastChart.Debug=true;
ForecastChart.Size = "1000x800";
ForecastChart.LegendBox.Template ="%icon %name";
ForecastChart.Type = ChartType.Scatter;
ForecastChart.XAxis.Minimum = 3040;
ForecastChart.XAxis.Maximum = 3480;
ForecastChart.XAxis.Interval = 40;
ForecastChart.YAxis.ScaleRange.ValueLow = 220;
ForecastChart.PaletteName = Palette.Three;
// The Forecast data
DataEngine de = new DataEngine ();
de.ConnectionString = ConfigurationManager.AppSettings["DNCConnectionString"];
de.DateGrouping = TimeInterval.Days;
de.StartDate = new DateTime(1983,3,10,0,0,0);
de.EndDate = new DateTime(1984,12,10,23,59,59);
de.SqlStatement= @"SELECT ID, Value AS q FROM Exchange WHERE Data >= #STARTDATE# AND Data <= #ENDDATE# ORDER BY Data ";
//Add a series
SeriesCollection scForecast = de.GetSeries ();
ForecastChart.SeriesCollection.Add (scForecast);
scForecast[0].Name = "Exchange";
scForecast[0].Type = SeriesType.Spline;
/*
* Takes off the marker off the line and spline series.
*/
ForecastChart.DefaultSeries.DefaultElement.Marker = new ElementMarker (ElementMarkerType.None);
ForecastChart.ChartAreaLayout.Mode = ChartAreaLayoutMode.Vertical;
// Generate a series of standard deviation for the given points
Series deviation = new Series();
for (int i = 0; i < scForecast[0].Elements.Count; i++ )
{
Element el = new Element();
el.XValue = scForecast[0].Elements[i].XValue;
el.YValue = 0.0000000001;
deviation.Elements.Add(el);
}
// Note that this line is necessary in order to clear the function basis set by previous
// example.
//
ForecastEngine.Options.Reset();
// Set the first model function
//
// The second basis element: (1)
ForecastEngine.Options.AddSumOfPowerTerms(new double[]{1}, new double[]{0});
// Generate a new series which will draw the best fit line according with the model function which we just set
Series generalLinear = new Series();
generalLinear = ForecastEngine.Advanced.GeneralLinear(scForecast[0], deviation);
generalLinear.Name = "0th Degree Polynomial";
generalLinear.Type = SeriesType.Spline;
ForecastChart.SeriesCollection.Add(generalLinear);
// Set the second model function ; we add x function to the basis functions
ForecastEngine.Options.AddSumOfPowerTerms(new double[]{1}, new double[]{1});
// Generate a new series which will draw the best fit line according with the model function which we just set
Series generalLinearModel2 = new Series();
generalLinearModel2 = ForecastEngine.Advanced.GeneralLinear(scForecast[0], deviation);
generalLinearModel2.Name = "1st Degree Polynomial";
generalLinearModel2.Type = SeriesType.Spline;
ForecastChart.SeriesCollection.Add(generalLinearModel2);
// Set the third model function ; we add x^2 function to the basis functions
ForecastEngine.Options.AddSumOfPowerTerms(new double[]{1}, new double[]{2});
// Generate a new series which will draw the best fit line according with the model function which we just set
Series generalLinearModel3 = new Series();
generalLinearModel3 = ForecastEngine.Advanced.GeneralLinear(scForecast[0], deviation);
generalLinearModel3.Name = "2nd Degree Polynomial";
generalLinearModel3.Type = SeriesType.Spline;
ForecastChart.SeriesCollection.Add(generalLinearModel3);
// We add x^3 function to the basis functions
ForecastEngine.Options.AddSumOfPowerTerms(new double[]{1}, new double[]{3});
// Generate a new series which will draw the best fit line according with the model function which we just set
Series generalLinearModel4 = new Series();
generalLinearModel4 = ForecastEngine.Advanced.GeneralLinear(scForecast[0], deviation);
generalLinearModel4.Name = "3rd Degree Polynomial";
generalLinearModel4.Type = SeriesType.Spline;
ForecastChart.SeriesCollection.Add(generalLinearModel4);
// We add x^4 function to the basis functions
ForecastEngine.Options.AddSumOfPowerTerms(new double[]{1}, new double[]{4});
// Generate a new series which will draw the best fit line according with the model function which we just set
Series generalLinearModel5 = new Series();
generalLinearModel5 = ForecastEngine.Advanced.GeneralLinear(scForecast[0], deviation);
generalLinearModel5.Name = "4th Degree Polynomial";
generalLinearModel5.Type = SeriesType.Spline;
ForecastChart.SeriesCollection.Add(generalLinearModel5);
// We add x^5 function to the basis functions
ForecastEngine.Options.AddSumOfPowerTerms(new double[]{1}, new double[]{5});
// Generate a new series which will draw the best fit line according with the model function which we just set
Series generalLinearModel6 = new Series();
generalLinearModel6 = ForecastEngine.Advanced.GeneralLinear(scForecast[0], deviation);
generalLinearModel6.Name = "5th Degree Polynomial";
generalLinearModel6.Type = SeriesType.Spline;
ForecastChart.SeriesCollection.Add(generalLinearModel6);
// We add x^6 function to the basis functions
ForecastEngine.Options.AddSumOfPowerTerms(new double[]{1}, new double[]{6});
// Generate a new series which will draw the best fit line according with the model function which we just set
Series generalLinearModel7 = new Series();
generalLinearModel7 = ForecastEngine.Advanced.GeneralLinear(scForecast[0], deviation);
generalLinearModel7.Name = "6th Degree Polynomial";
generalLinearModel7.Type = SeriesType.Spline;
ForecastChart.SeriesCollection.Add(generalLinearModel7);
// We add x^7 function to the basis functions
ForecastEngine.Options.AddSumOfPowerTerms(new double[]{1}, new double[]{7});
// Generate a new series which will draw the best fit line according with the model function which we just set
Series generalLinearModel8 = new Series();
generalLinearModel8 = ForecastEngine.Advanced.GeneralLinear(scForecast[0], deviation);
generalLinearModel8.Name = "7th Degree Polynomial";
generalLinearModel8.Type = SeriesType.Spline;
ForecastChart.SeriesCollection.Add(generalLinearModel8);
// Fit the 27th Degree Polynomial
ForecastEngine.Options.AddSumOfPowerTerms(new double[]{1}, new double[]{8});
ForecastEngine.Options.AddSumOfPowerTerms(new double[]{1}, new double[]{9});
ForecastEngine.Options.AddSumOfPowerTerms(new double[]{1}, new double[]{10});
ForecastEngine.Options.AddSumOfPowerTerms(new double[]{1}, new double[]{11});
ForecastEngine.Options.AddSumOfPowerTerms(new double[]{1}, new double[]{12});
ForecastEngine.Options.AddSumOfPowerTerms(new double[]{1}, new double[]{13});
ForecastEngine.Options.AddSumOfPowerTerms(new double[]{1}, new double[]{14});
ForecastEngine.Options.AddSumOfPowerTerms(new double[]{1}, new double[]{15});
ForecastEngine.Options.AddSumOfPowerTerms(new double[]{1}, new double[]{16});
ForecastEngine.Options.AddSumOfPowerTerms(new double[]{1}, new double[]{17});
ForecastEngine.Options.AddSumOfPowerTerms(new double[]{1}, new double[]{18});
ForecastEngine.Options.AddSumOfPowerTerms(new double[]{1}, new double[]{19});
ForecastEngine.Options.AddSumOfPowerTerms(new double[]{1}, new double[]{20});
ForecastEngine.Options.AddSumOfPowerTerms(new double[]{1}, new double[]{21});
ForecastEngine.Options.AddSumOfPowerTerms(new double[]{1}, new double[]{22});
ForecastEngine.Options.AddSumOfPowerTerms(new double[]{1}, new double[]{23});
ForecastEngine.Options.AddSumOfPowerTerms(new double[]{1}, new double[]{24});
ForecastEngine.Options.AddSumOfPowerTerms(new double[]{1}, new double[]{25});
ForecastEngine.Options.AddSumOfPowerTerms(new double[]{1}, new double[]{26});
ForecastEngine.Options.AddSumOfPowerTerms(new double[]{1}, new double[]{27});
// Generate a new series which will draw the function of best from the fnuctoin spacce available.
Series generalLinearModel9 = new Series();
generalLinearModel9 = ForecastEngine.Advanced.GeneralLinear(scForecast[0], deviation);
generalLinearModel9.Name = "27th Degree Polynomial";
generalLinearModel9.DefaultElement.Color = Color.FromArgb(0,0,0);
generalLinearModel9.Type = SeriesType.Spline;
ForecastChart.SeriesCollection.Add(generalLinearModel9);
}
</script>
</head>
<body>
<div style="text-align:center">
<dotnet:Chart id="ForecastChart" runat="server"/>
</div>
</body>
</html>
<%@ Page Language="vb" Description="dotnetCHARTING Component" %>
<%@ Register TagPrefix="dotnet" Namespace="dotnetCHARTING" Assembly="dotnetCHARTING"%>
<%@ Import Namespace="System.Drawing" %>
<%@ Import Namespace="System.Drawing.Drawing2D" %>
<%@ Import Namespace="dotnetCHARTING"%>
<html xmlns="http://www.w3.org/1999/xhtml">
<head>
<title>.netCHARTING Forecasting Sample</title>
<script runat="server">
Sub Page_Load(ByVal sender As Object, ByVal e As EventArgs)
' Demonstrates the use of GeneralLinear Forecasting engine in order to
' find the function of best fit from three functions spaces. The data used for which
' the fuctions are fit is a set of data which represents a FX exchange rate over a given
' period of time. We index the period by the number of days after the inital date and the
' eights function spaces are the spaces spanned by the following basis elements:
'
' 1) {(1)}
' 2) {(1), (x)}
' 3) {(1), (x), (x^2)}
' 4) {(1), (x), (x^2), (x^3)}
' 5) {(1), (x), (x^2), (x^3), (x^4)}
' 6) {(1), (x), (x^2), (x^3), (x^4), (x^5)}
' 7) {(1), (x), (x^2), (x^3), (x^4), (x^5), (x^6)}
' 8) {(1), (x), (x^2), (x^3), (x^4), (x^5), (x^6), (x^7)}
'
' The Forecast Chart
ForecastChart.Title="Exchange"
ForecastChart.TempDirectory="temp"
ForecastChart.Debug=True
ForecastChart.Size = "1000x800"
ForecastChart.LegendBox.Template ="%icon %name"
ForecastChart.Type = ChartType.Scatter
ForecastChart.XAxis.Minimum = 3040
ForecastChart.XAxis.Maximum = 3480
ForecastChart.XAxis.Interval = 40
ForecastChart.YAxis.ScaleRange.ValueLow = 220
ForecastChart.PaletteName = Palette.Three
' The Forecast data
Dim de As DataEngine = New DataEngine ()
de.ConnectionString = ConfigurationManager.AppSettings("DNCConnectionString")
de.DateGrouping = TimeInterval.Days
de.StartDate = New DateTime(1983,3,10,0,0,0)
de.EndDate = New DateTime(1984,12,10,23,59,59)
de.SqlStatement= "SELECT ID, Value AS q FROM Exchange WHERE Data >= #STARTDATE# AND Data <= #ENDDATE# ORDER BY Data "
'Add a series
Dim scForecast As SeriesCollection = de.GetSeries ()
ForecastChart.SeriesCollection.Add (scForecast)
scForecast(0).Name = "Exchange"
scForecast(0).Type = SeriesType.Spline
'
'* Takes off the marker off the line and spline series.
'
ForecastChart.DefaultSeries.DefaultElement.Marker = New ElementMarker (ElementMarkerType.None)
ForecastChart.ChartAreaLayout.Mode = ChartAreaLayoutMode.Vertical
' Generate a series of standard deviation for the given points
Dim deviation As Series = New Series()
For i As Integer = 0 To scForecast(0).Elements.Count - 1
Dim el As Element = New Element()
el.XValue = scForecast(0).Elements(i).XValue
el.YValue = 0.0000000001
deviation.Elements.Add(el)
Next i
' Note that this line is necessary in order to clear the function basis set by previous
' example.
'
ForecastEngine.Options.Reset()
' Set the first model function
'
' The second basis element: (1)
ForecastEngine.Options.AddSumOfPowerTerms(New Double(){1}, New Double(){0})
' Generate a new series which will draw the best fit line according with the model function which we just set
Dim generalLinear As Series = New Series()
generalLinear = ForecastEngine.Advanced.GeneralLinear(scForecast(0), deviation)
generalLinear.Name = "0th Degree Polynomial"
generalLinear.Type = SeriesType.Spline
ForecastChart.SeriesCollection.Add(generalLinear)
' Set the second model function ; we add x function to the basis functions
ForecastEngine.Options.AddSumOfPowerTerms(New Double(){1}, New Double(){1})
' Generate a new series which will draw the best fit line according with the model function which we just set
Dim generalLinearModel2 As Series = New Series()
generalLinearModel2 = ForecastEngine.Advanced.GeneralLinear(scForecast(0), deviation)
generalLinearModel2.Name = "1st Degree Polynomial"
generalLinearModel2.Type = SeriesType.Spline
ForecastChart.SeriesCollection.Add(generalLinearModel2)
' Set the third model function ; we add x^2 function to the basis functions
ForecastEngine.Options.AddSumOfPowerTerms(New Double(){1}, New Double(){2})
' Generate a new series which will draw the best fit line according with the model function which we just set
Dim generalLinearModel3 As Series = New Series()
generalLinearModel3 = ForecastEngine.Advanced.GeneralLinear(scForecast(0), deviation)
generalLinearModel3.Name = "2nd Degree Polynomial"
generalLinearModel3.Type = SeriesType.Spline
ForecastChart.SeriesCollection.Add(generalLinearModel3)
' We add x^3 function to the basis functions
ForecastEngine.Options.AddSumOfPowerTerms(New Double(){1}, New Double(){3})
' Generate a new series which will draw the best fit line according with the model function which we just set
Dim generalLinearModel4 As Series = New Series()
generalLinearModel4 = ForecastEngine.Advanced.GeneralLinear(scForecast(0), deviation)
generalLinearModel4.Name = "3rd Degree Polynomial"
generalLinearModel4.Type = SeriesType.Spline
ForecastChart.SeriesCollection.Add(generalLinearModel4)
' We add x^4 function to the basis functions
ForecastEngine.Options.AddSumOfPowerTerms(New Double(){1}, New Double(){4})
' Generate a new series which will draw the best fit line according with the model function which we just set
Dim generalLinearModel5 As Series = New Series()
generalLinearModel5 = ForecastEngine.Advanced.GeneralLinear(scForecast(0), deviation)
generalLinearModel5.Name = "4th Degree Polynomial"
generalLinearModel5.Type = SeriesType.Spline
ForecastChart.SeriesCollection.Add(generalLinearModel5)
' We add x^5 function to the basis functions
ForecastEngine.Options.AddSumOfPowerTerms(New Double(){1}, New Double(){5})
' Generate a new series which will draw the best fit line according with the model function which we just set
Dim generalLinearModel6 As Series = New Series()
generalLinearModel6 = ForecastEngine.Advanced.GeneralLinear(scForecast(0), deviation)
generalLinearModel6.Name = "5th Degree Polynomial"
generalLinearModel6.Type = SeriesType.Spline
ForecastChart.SeriesCollection.Add(generalLinearModel6)
' We add x^6 function to the basis functions
ForecastEngine.Options.AddSumOfPowerTerms(New Double(){1}, New Double(){6})
' Generate a new series which will draw the best fit line according with the model function which we just set
Dim generalLinearModel7 As Series = New Series()
generalLinearModel7 = ForecastEngine.Advanced.GeneralLinear(scForecast(0), deviation)
generalLinearModel7.Name = "6th Degree Polynomial"
generalLinearModel7.Type = SeriesType.Spline
ForecastChart.SeriesCollection.Add(generalLinearModel7)
' We add x^7 function to the basis functions
ForecastEngine.Options.AddSumOfPowerTerms(New Double(){1}, New Double(){7})
' Generate a new series which will draw the best fit line according with the model function which we just set
Dim generalLinearModel8 As Series = New Series()
generalLinearModel8 = ForecastEngine.Advanced.GeneralLinear(scForecast(0), deviation)
generalLinearModel8.Name = "7th Degree Polynomial"
generalLinearModel8.Type = SeriesType.Spline
ForecastChart.SeriesCollection.Add(generalLinearModel8)
' Fit the 27th Degree Polynomial
ForecastEngine.Options.AddSumOfPowerTerms(New Double(){1}, New Double(){8})
ForecastEngine.Options.AddSumOfPowerTerms(New Double(){1}, New Double(){9})
ForecastEngine.Options.AddSumOfPowerTerms(New Double(){1}, New Double(){10})
ForecastEngine.Options.AddSumOfPowerTerms(New Double(){1}, New Double(){11})
ForecastEngine.Options.AddSumOfPowerTerms(New Double(){1}, New Double(){12})
ForecastEngine.Options.AddSumOfPowerTerms(New Double(){1}, New Double(){13})
ForecastEngine.Options.AddSumOfPowerTerms(New Double(){1}, New Double(){14})
ForecastEngine.Options.AddSumOfPowerTerms(New Double(){1}, New Double(){15})
ForecastEngine.Options.AddSumOfPowerTerms(New Double(){1}, New Double(){16})
ForecastEngine.Options.AddSumOfPowerTerms(New Double(){1}, New Double(){17})
ForecastEngine.Options.AddSumOfPowerTerms(New Double(){1}, New Double(){18})
ForecastEngine.Options.AddSumOfPowerTerms(New Double(){1}, New Double(){19})
ForecastEngine.Options.AddSumOfPowerTerms(New Double(){1}, New Double(){20})
ForecastEngine.Options.AddSumOfPowerTerms(New Double(){1}, New Double(){21})
ForecastEngine.Options.AddSumOfPowerTerms(New Double(){1}, New Double(){22})
ForecastEngine.Options.AddSumOfPowerTerms(New Double(){1}, New Double(){23})
ForecastEngine.Options.AddSumOfPowerTerms(New Double(){1}, New Double(){24})
ForecastEngine.Options.AddSumOfPowerTerms(New Double(){1}, New Double(){25})
ForecastEngine.Options.AddSumOfPowerTerms(New Double(){1}, New Double(){26})
ForecastEngine.Options.AddSumOfPowerTerms(New Double(){1}, New Double(){27})
' Generate a new series which will draw the function of best from the fnuctoin spacce available.
Dim generalLinearModel9 As Series = New Series()
generalLinearModel9 = ForecastEngine.Advanced.GeneralLinear(scForecast(0), deviation)
generalLinearModel9.Name = "27th Degree Polynomial"
generalLinearModel9.DefaultElement.Color = Color.FromArgb(0,0,0)
generalLinearModel9.Type = SeriesType.Spline
ForecastChart.SeriesCollection.Add(generalLinearModel9)
End Sub
</script>
</head>
<body>
<div style="text-align:center">
<dotnet:Chart id="ForecastChart" runat="server"/>
</div>
</body>
</html>
- Sample FilenamePolynomialFitting.aspx
- VersionLegacy (Pre 3.0)
- Uses DatabaseYes