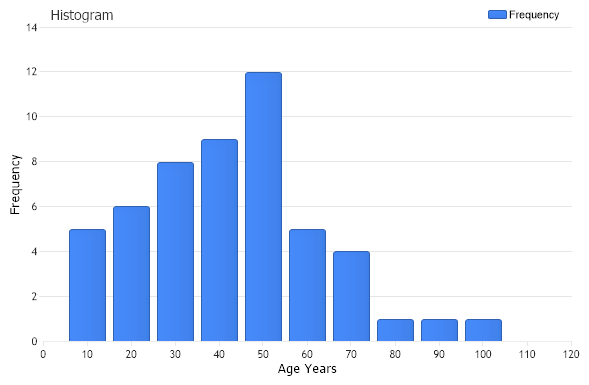
Age Histogram
Demonstrates the use of statistical procedures for summarize quantitative data from within StatisticalEngine.
<%@ Page Language="C#" Description="dotnetCHARTING Component" %>
<%@ Register TagPrefix="dotnet" Namespace="dotnetCHARTING" Assembly="dotnetCHARTING"%>
<%@ Import Namespace="System.Drawing" %>
<%@ Import Namespace="System.Drawing.Drawing2D" %>
<%@ Import Namespace="dotnetCHARTING"%>
<html xmlns="http://www.w3.org/1999/xhtml">
<head>
<title>.netCHARTING Sample</title>
<script runat="server">
void Page_Load(Object sender,EventArgs e)
{
// Demonstrates the use of statistical procedures for summarize quantitative data from within StatisticalEngine.
// In this sample we show the age distributions of a doctor's Patients. The age is
// given in years.
// The Histogram Chart
HistogramChart.Title="Histogram";
HistogramChart.TempDirectory = "temp";
HistogramChart.Debug=true;
HistogramChart.Size = "600x400";
HistogramChart.LegendBox.Template ="%icon %name";
HistogramChart.XAxis.Scale = Scale.Normal;
HistogramChart.XAxis.Label.Text = "Age Years";
HistogramChart.YAxis.Label.Text = "Frequency";
HistogramChart.TitleBox.Position = TitleBoxPosition.FullWithLegend;
HistogramChart.XAxis.Interval=10;
// *DYNAMIC DATA NOTE*
// This sample uses random data to populate the chart. To populate
// a chart with database data see the following resources:
// - Classic samples folder
// - Help File > Data Tutorials
// - Sample: features/DataEngine.aspx
Series sampledata = getSampleData();
// CFrequencyTableAOL - Calculates the cumulative frequency table from above for a discrete data set
// in accordance with the open left boundary (OLB) convention.
Series ftableOL = StatisticalEngine.FrequencyTableOL("Frequency", sampledata, new double[] {10,20,30,40,50,60,70,80,90,100});
HistogramChart.SeriesCollection.Add(ftableOL);
}
Series getSampleData()
{
int[] PatientsAge = new int[] {2,20,11,50,13,56,47,87,67,13,50,35,27,54,48,65,23,32,45,91,4,11,21,3,50,33,
35,27,54,5,39,45,47,25,28,39,43,61,28,59,63,32,15,24,71,36,36,48,49,50,60,9};
Series sampledata = new Series ("Age");
for ( int i=0; i < PatientsAge.Length; i++)
{
Element el = new Element();
el.YValue = PatientsAge[i];
sampledata.Elements.Add (el);
}
return sampledata;
}
</script>
</head>
<body>
<div style="text-align:center">
<dotnet:Chart id="HistogramChart" runat="server"/>
</div>
</body>
</html>
<%@ Page Language="vb" Description="dotnetCHARTING Component" %>
<%@ Register TagPrefix="dotnet" Namespace="dotnetCHARTING" Assembly="dotnetCHARTING"%>
<%@ Import Namespace="System.Drawing" %>
<%@ Import Namespace="System.Drawing.Drawing2D" %>
<%@ Import Namespace="dotnetCHARTING"%>
<html xmlns="http://www.w3.org/1999/xhtml">
<head>
<title>.netCHARTING Sample</title>
<script runat="server">
Sub Page_Load(ByVal sender As Object, ByVal e As EventArgs)
' Demonstrates the use of statistical procedures for summarize quantitative data from within StatisticalEngine.
' In this sample we show the age distributions of a doctor's Patients. The age is
' given in years.
' The Histogram Chart
HistogramChart.Title="Histogram"
HistogramChart.TempDirectory = "temp"
HistogramChart.Debug=True
HistogramChart.Size = "600x400"
HistogramChart.LegendBox.Template ="%icon %name"
HistogramChart.XAxis.Scale = Scale.Normal
HistogramChart.XAxis.Label.Text = "Age Years"
HistogramChart.YAxis.Label.Text = "Frequency"
HistogramChart.TitleBox.Position = TitleBoxPosition.FullWithLegend
HistogramChart.XAxis.Interval=10
' *DYNAMIC DATA NOTE*
' This sample uses random data to populate the chart. To populate
' a chart with database data see the following resources:
' - Classic samples folder
' - Help File > Data Tutorials
' - Sample: features/DataEngine.aspx
Dim sampledata As Series = getSampleData()
' CFrequencyTableAOL - Calculates the cumulative frequency table from above for a discrete data set
' in accordance with the open left boundary (OLB) convention.
Dim ftableOL As Series = StatisticalEngine.FrequencyTableOL("Frequency", sampledata, New Double() {10,20,30,40,50,60,70,80,90,100})
HistogramChart.SeriesCollection.Add(ftableOL)
End Sub
Function getSampleData() As Series
Dim PatientsAge As Integer() = New Integer() {2,20,11,50,13,56,47,87,67,13,50,35,27,54,48,65,23,32,45,91,4,11,21,3,50,33, 35,27,54,5,39,45,47,25,28,39,43,61,28,59,63,32,15,24,71,36,36,48,49,50,60,9}
Dim sampledata As Series = New Series ("Age")
For i As Integer = 0 To PatientsAge.Length - 1
Dim el As Element = New Element()
el.YValue = PatientsAge(i)
sampledata.Elements.Add (el)
Next i
Return sampledata
End Function
</script>
</head>
<body>
<div style="text-align:center">
<dotnet:Chart id="HistogramChart" runat="server"/>
</div>
</body>
</html>