Gallery
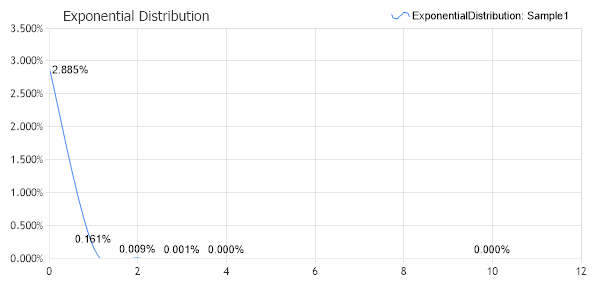
Exponential Distribution 1
<%@ Page Language="C#" Description="dotnetCHARTING Component" %>
<%@ Register TagPrefix="dotnet" Namespace="dotnetCHARTING" Assembly="dotnetCHARTING"%>
<%@ Import Namespace="System.Drawing" %>
<html xmlns="http://www.w3.org/1999/xhtml">
<head>
<title>.netCHARTING Sample</title>
<script runat="server">
void Page_Load(Object sender,EventArgs e)
{
// Demonstrates the use of Exponential Distribution within StatisticalEngine.
// The Distribution Chart
DistributionChart.Title=" Exponential Distribution";
DistributionChart.TempDirectory = "temp";
DistributionChart.Debug=true;
DistributionChart.Size = "600x300";
DistributionChart.LegendBox.Template ="%icon %name";
DistributionChart.YAxis.Percent = true;
DistributionChart.TitleBox.Position = TitleBoxPosition.FullWithLegend;
DistributionChart.DefaultSeries.DefaultElement.Marker.Visible = false;
DistributionChart.YAxis.FormatString = "n3";
DistributionChart.YAxis.Scale = Scale.Range;
DistributionChart.XAxis.Interval = 2;
double[] expDistVector = new double[] {0,1, 2, 3, 4, 10};
Series sampledata = new Series ("Sample1");
for ( int i=0; i < expDistVector.Length; i++) {
Element el = new Element();
el.XValue = expDistVector[i];
sampledata.Elements.Add (el);
}
// The second parameter of this method is the scale parameter of the exponential probability distribution
Series expDistribution = StatisticalEngine.ExponentialDistribution(sampledata,3.67);
expDistribution.Type = SeriesType.Spline;
expDistribution.DefaultElement.ShowValue = true;
expDistribution.DefaultElement.SmartLabel.Text = "%YValue%";
expDistribution.DefaultElement.SmartLabel.Color = Color.Black;
DistributionChart.SeriesCollection.Add (expDistribution);
}
</script>
</head>
<body>
<div style="text-align:center">
<dotnet:Chart id="DistributionChart" runat="server"/>
</div>
</body>
</html>
<%@ Page Language="vb" Description="dotnetCHARTING Component" %>
<%@ Register TagPrefix="dotnet" Namespace="dotnetCHARTING" Assembly="dotnetCHARTING"%>
<%@ Import Namespace="System.Drawing" %>
<html xmlns="http://www.w3.org/1999/xhtml">
<head>
<title>.netCHARTING Sample</title>
<script runat="server">
Sub Page_Load(ByVal sender As Object, ByVal e As EventArgs)
' Demonstrates the use of Exponential Distribution within StatisticalEngine.
' The Distribution Chart
DistributionChart.Title=" Exponential Distribution"
DistributionChart.TempDirectory = "temp"
DistributionChart.Debug=True
DistributionChart.Size = "600x300"
DistributionChart.LegendBox.Template ="%icon %name"
DistributionChart.YAxis.Percent = True
DistributionChart.TitleBox.Position = TitleBoxPosition.FullWithLegend
DistributionChart.DefaultSeries.DefaultElement.Marker.Visible = False
DistributionChart.YAxis.FormatString = "n3"
DistributionChart.YAxis.Scale = Scale.Range
DistributionChart.XAxis.Interval = 2
Dim expDistVector As Double() = New Double() {0,1, 2, 3, 4, 10}
Dim sampledata As Series = New Series ("Sample1")
For i As Integer = 0 To expDistVector.Length - 1
Dim el As Element = New Element()
el.XValue = expDistVector(i)
sampledata.Elements.Add (el)
Next i
' The second parameter of this method is the scale parameter of the exponential probability distribution
Dim expDistribution As Series = StatisticalEngine.ExponentialDistribution(sampledata,3.67)
expDistribution.Type = SeriesType.Spline
expDistribution.DefaultElement.ShowValue = True
expDistribution.DefaultElement.SmartLabel.Text = "%YValue%"
expDistribution.DefaultElement.SmartLabel.Color = Color.Black
DistributionChart.SeriesCollection.Add (expDistribution)
End Sub
</script>
</head>
<body>
<div style="text-align:center">
<dotnet:Chart id="DistributionChart" runat="server"/>
</div>
</body>
</html>
- Sample FilenameExponentialDistribution1.aspx
- Version4.0
- Uses DatabaseNo