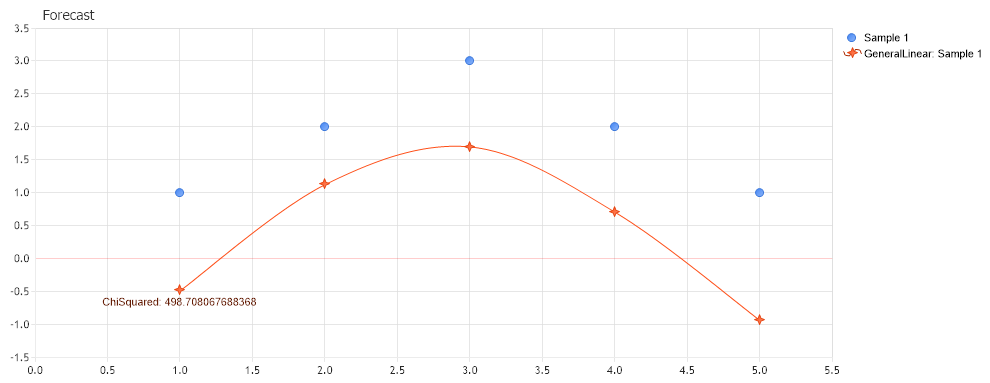
Gallery
General Linear
<%@ Page Language="C#" Description="dotnetCHARTING Component" %>
<%@ Register TagPrefix="dotnet" Namespace="dotnetCHARTING" Assembly="dotnetCHARTING"%>
<%@ Import Namespace="System.Drawing" %>
<%@ Import Namespace="System.Drawing.Drawing2D" %>
<%@ Import Namespace="dotnetCHARTING"%>
<html xmlns="http://www.w3.org/1999/xhtml">
<head>
<title>.netCHARTING General Linear Sample</title>
<script runat="server">
void Page_Load(Object sender,EventArgs e)
{
// Demonstrates the use of GeneralLinear indicator
// from the ForecastEngine
// The Forecast Chart
ForecastChart.Title="Forecast";
ForecastChart.TempDirectory="temp";
ForecastChart.Debug=true;
ForecastChart.Size = "1000x400";
ForecastChart.LegendBox.Template ="%icon %name";
ForecastChart.XAxis.Scale = Scale.Normal;
SeriesCollection sForecast = new SeriesCollection();
Series sampledata1 = new Series ("Sample 1");
Series deviation = new Series ("Standard Deviation");
Element el1 = new Element();
el1.XValue = 1;
el1.YValue = 1;
sampledata1.Elements.Add(el1);
Element el2 = new Element();
el2.XValue = 2;
el2.YValue = 2;
sampledata1.Elements.Add(el2);
Element el3 = new Element();
el3.XValue = 3;
el3.YValue = 3;
sampledata1.Elements.Add(el3);
Element el4 = new Element();
el4.XValue = 4;
el4.YValue = 2;
sampledata1.Elements.Add(el4);
Element el5 = new Element();
el5.XValue = 5;
el5.YValue = 1;
sampledata1.Elements.Add(el5);
Element dev1 = new Element();
dev1.XValue = 1;
dev1.YValue = 0.1;
deviation.Elements.Add(dev1);
Element dev2 = new Element();
dev2.XValue = 2;
dev2.YValue = 0.2;
deviation.Elements.Add(dev2);
Element dev3 = new Element();
dev3.XValue = 3;
dev3.YValue = 0.3;
deviation.Elements.Add(el3);
Element dev4 = new Element();
dev4.XValue = 4;
dev4.YValue = 0.1;
deviation.Elements.Add(dev4);
Element dev5 = new Element();
dev5.XValue = 5;
dev5.YValue = 0.2;
deviation.Elements.Add(dev5);
sForecast.Add (sampledata1);
sForecast[0].Type = SeriesType.Marker;
ForecastChart.SeriesCollection.Add (sForecast);
// Note that this line is necessary in order to
//clear the function basis set by previous example.
ForecastEngine.Options.Reset();
// Set the model function : sin(x) + cos(x)
ForecastEngine.Options.AddCosineSum(new double[]{1}, new double[]{1}, new double[] {0}, new double[] {1});
ForecastEngine.Options.AddSineSum(new double[]{1}, new double[]{1}, new double[] {0}, new double[] {1});
// Generate a new series which will draw the best fit line according with the model
// function which we just set.
Series generalLinear = new Series();
generalLinear = ForecastEngine.Advanced.GeneralLinear(sampledata1, deviation);
//The next two lines display on to the chart the value of the ChiSquare
generalLinear.Elements[0].SmartLabel.Text = "ChiSquared: %ChiSquare";
generalLinear.Elements[0].ShowValue = true;
generalLinear.Type = SeriesType.Spline;
ForecastChart.SeriesCollection.Add(generalLinear);
ForecastEngine.Options.Reset();
}
</script>
</head>
<body>
<div style="text-align:center">
<dotnet:Chart id="ForecastChart" runat="server"/>
</div>
</body>
</html>
<%@ Page Language="vb" Description="dotnetCHARTING Component" %>
<%@ Register TagPrefix="dotnet" Namespace="dotnetCHARTING" Assembly="dotnetCHARTING"%>
<%@ Import Namespace="System.Drawing" %>
<%@ Import Namespace="System.Drawing.Drawing2D" %>
<%@ Import Namespace="dotnetCHARTING"%>
<html xmlns="http://www.w3.org/1999/xhtml">
<head>
<title>.netCHARTING General Linear Sample</title>
<script runat="server">
Sub Page_Load(ByVal sender As Object, ByVal e As EventArgs)
' Demonstrates the use of GeneralLinear indicator
' from the ForecastEngine
' The Forecast Chart
ForecastChart.Title="Forecast"
ForecastChart.TempDirectory="temp"
ForecastChart.Debug=True
ForecastChart.Size = "1000x400"
ForecastChart.LegendBox.Template ="%icon %name"
ForecastChart.XAxis.Scale = Scale.Normal
Dim sForecast As SeriesCollection = New SeriesCollection()
Dim sampledata1 As Series = New Series ("Sample 1")
Dim deviation As Series = New Series ("Standard Deviation")
Dim el1 As Element = New Element()
el1.XValue = 1
el1.YValue = 1
sampledata1.Elements.Add(el1)
Dim el2 As Element = New Element()
el2.XValue = 2
el2.YValue = 2
sampledata1.Elements.Add(el2)
Dim el3 As Element = New Element()
el3.XValue = 3
el3.YValue = 3
sampledata1.Elements.Add(el3)
Dim el4 As Element = New Element()
el4.XValue = 4
el4.YValue = 2
sampledata1.Elements.Add(el4)
Dim el5 As Element = New Element()
el5.XValue = 5
el5.YValue = 1
sampledata1.Elements.Add(el5)
Dim dev1 As Element = New Element()
dev1.XValue = 1
dev1.YValue = 0.1
deviation.Elements.Add(dev1)
Dim dev2 As Element = New Element()
dev2.XValue = 2
dev2.YValue = 0.2
deviation.Elements.Add(dev2)
Dim dev3 As Element = New Element()
dev3.XValue = 3
dev3.YValue = 0.3
deviation.Elements.Add(el3)
Dim dev4 As Element = New Element()
dev4.XValue = 4
dev4.YValue = 0.1
deviation.Elements.Add(dev4)
Dim dev5 As Element = New Element()
dev5.XValue = 5
dev5.YValue = 0.2
deviation.Elements.Add(dev5)
sForecast.Add (sampledata1)
sForecast(0).Type = SeriesType.Marker
ForecastChart.SeriesCollection.Add (sForecast)
' Note that this line is necessary in order to
'clear the function basis set by previous example.
ForecastEngine.Options.Reset()
' Set the model function : sin(x) + cos(x)
ForecastEngine.Options.AddCosineSum(New Double(){1}, New Double(){1}, New Double() {0}, New Double() {1})
ForecastEngine.Options.AddSineSum(New Double(){1}, New Double(){1}, New Double() {0}, New Double() {1})
' Generate a new series which will draw the best fit line according with the model
' function which we just set.
Dim generalLinear As Series = New Series()
generalLinear = ForecastEngine.Advanced.GeneralLinear(sampledata1, deviation)
'The next two lines display on to the chart the value of the ChiSquare
generalLinear.Elements(0).SmartLabel.Text = "ChiSquared: %ChiSquare"
generalLinear.Elements(0).ShowValue = True
generalLinear.Type = SeriesType.Spline
ForecastChart.SeriesCollection.Add(generalLinear)
ForecastEngine.Options.Reset()
End Sub
</script>
</head>
<body>
<div style="text-align:center">
<dotnet:Chart id="ForecastChart" runat="server"/>
</div>
</body>
</html>
- Sample FilenameGeneralLinear.aspx
- VersionLegacy (Pre 3.0)
- Uses DatabaseNo