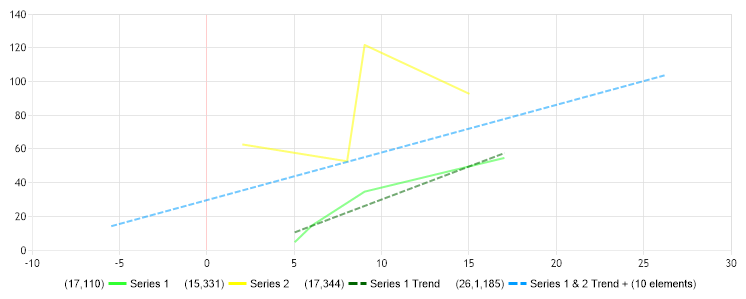
Trendline Scatter
Derive trend lines from your scatter data.
<%@ Page Language="C#" Description="dotnetCHARTING Component" %>
<%@ Register TagPrefix="dotnet" Namespace="dotnetCHARTING" Assembly="dotnetCHARTING"%>
<%@ Import Namespace="System.Drawing" %>
<%@ Import Namespace="System.Drawing.Drawing2D" %>
<html xmlns="http://www.w3.org/1999/xhtml">
<head>
<title>Trend Line Scatter</title>
<script runat="server">
void Page_Load(Object sender,EventArgs e)
{
Chart.Type = ChartType.Scatter;
Chart.Width = 750;
Chart.Height = 300;
Chart.TempDirectory = "temp";
Chart.Debug = true;
Chart.DefaultSeries.Line.Width = 2;
Chart.DefaultSeries.DefaultElement.Transparency = 45;
Chart.LegendBox.Position = LegendBoxPosition.BottomMiddle;
Chart.DefaultSeries.DefaultElement.Marker.Type = ElementMarkerType.None;
Chart.DefaultSeries.Type = SeriesType.Line;
// Demonstrates how to derive trend lines from your scatter data.
// First we get our data, if you would like to get the data from a database you need to use
// the data engine. See sample: features/dataEngine.aspx. Or the dataEngine tutorial in the help file.
SeriesCollection mySC = getRandomData();
// Get a trend line from series 1. Because only the SeriesCollection Calculate method returns a series a
// SeriesCollection is instantiated and the method is used.
Series trend1 = (new SeriesCollection(mySC[0])).Calculate("Series 1 Trend",Calculation.TrendLineLinearScatter);
// Set a line dash style.
trend1.Line.DashStyle = DashStyle.Dash;
//We'll give this line a green color so it looks like it relates to the yellow bars of series 1
trend1.DefaultElement.Color = Color.DarkGreen;//Color.FromArgb(25,225,25);
// Trend line from Series 1 & 2
// This time we want to predict what will happen 10 steps from now so we pass an extra parameter to the
// calculate method.
Series trend2 = mySC.Calculate("Series 1 & 2 Trend + (10 elements)",Calculation.TrendLineLinearScatter,10);
// Set a line dash style.
trend2.Line.DashStyle = DashStyle.Dash;
// Give this trend line a blue color.
trend2.DefaultElement.Color = Color.FromArgb(0,156,255);
// Add the trend lines to the collection.
mySC.Add(trend1);
mySC.Add(trend2);
// Add the random data.
Chart.SeriesCollection.Add(mySC);
}
SeriesCollection getRandomData()
{
SeriesCollection SC = new SeriesCollection();
Series s1 = new Series("Series 1");
s1.Elements.Add(new Element("",5,5));
s1.Elements.Add(new Element("",6,15));
s1.Elements.Add(new Element("",9,35));
s1.Elements.Add(new Element("",17,55));
Series s2 = new Series("Series 2");
s2.Elements.Add(new Element("",2,63));
s2.Elements.Add(new Element("",8,53));
s2.Elements.Add(new Element("",9,122));
s2.Elements.Add(new Element("",15,93));
s1.DefaultElement.Color = Color.FromArgb(49,255,49);
s2.DefaultElement.Color = Color.FromArgb(255,255,0);
SC.Add(s1);
SC.Add(s2);
return SC;
}
</script>
</head>
<body>
<div style="text-align:center">
<dotnet:Chart id="Chart" runat="server" Width="568px" Height="344px">
</dotnet:Chart>
</div>
</body>
</html>
<%@ Page Language="vb" Description="dotnetCHARTING Component" %>
<%@ Register TagPrefix="dotnet" Namespace="dotnetCHARTING" Assembly="dotnetCHARTING"%>
<%@ Import Namespace="System.Drawing" %>
<%@ Import Namespace="System.Drawing.Drawing2D" %>
<html xmlns="http://www.w3.org/1999/xhtml">
<head>
<title>Trend Line Scatter</title>
<script runat="server">
Sub Page_Load(ByVal sender As Object, ByVal e As EventArgs)
Chart.Type = ChartType.Scatter
Chart.Width = 750
Chart.Height = 300
Chart.TempDirectory = "temp"
Chart.Debug = True
Chart.DefaultSeries.Line.Width = 2
Chart.DefaultSeries.DefaultElement.Transparency = 45
Chart.LegendBox.Position = LegendBoxPosition.BottomMiddle
Chart.DefaultSeries.DefaultElement.Marker.Type = ElementMarkerType.None
Chart.DefaultSeries.Type = SeriesType.Line
' Demonstrates how to derive trend lines from your scatter data.
' First we get our data, if you would like to get the data from a database you need to use
' the data engine. See sample: features/dataEngine.aspx. Or the dataEngine tutorial in the help file.
Dim mySC As SeriesCollection = getRandomData()
' Get a trend line from series 1. Because only the SeriesCollection Calculate method returns a series a
' SeriesCollection is instantiated and the method is used.
Dim trend1 As Series = (New SeriesCollection(mySC(0))).Calculate("Series 1 Trend",Calculation.TrendLineLinearScatter)
' Set a line dash style.
trend1.Line.DashStyle = DashStyle.Dash
'We'll give this line a green color so it looks like it relates to the yellow bars of series 1
trend1.DefaultElement.Color = Color.DarkGreen 'Color.FromArgb(25,225,25);
' Trend line from Series 1 & 2
' This time we want to predict what will happen 10 steps from now so we pass an extra parameter to the
' calculate method.
Dim trend2 As Series = mySC.Calculate("Series 1 & 2 Trend + (10 elements)",Calculation.TrendLineLinearScatter,10)
' Set a line dash style.
trend2.Line.DashStyle = DashStyle.Dash
' Give this trend line a blue color.
trend2.DefaultElement.Color = Color.FromArgb(0,156,255)
' Add the trend lines to the collection.
mySC.Add(trend1)
mySC.Add(trend2)
' Add the random data.
Chart.SeriesCollection.Add(mySC)
End Sub
Function getRandomData() As SeriesCollection
Dim SC As SeriesCollection = New SeriesCollection()
Dim s1 As Series = New Series("Series 1")
s1.Elements.Add(New Element("",5,5))
s1.Elements.Add(New Element("",6,15))
s1.Elements.Add(New Element("",9,35))
s1.Elements.Add(New Element("",17,55))
Dim s2 As Series = New Series("Series 2")
s2.Elements.Add(New Element("",2,63))
s2.Elements.Add(New Element("",8,53))
s2.Elements.Add(New Element("",9,122))
s2.Elements.Add(New Element("",15,93))
s1.DefaultElement.Color = Color.FromArgb(49,255,49)
s2.DefaultElement.Color = Color.FromArgb(255,255,0)
SC.Add(s1)
SC.Add(s2)
Return SC
End Function
</script>
</head>
<body>
<div style="text-align:center">
<dotnet:Chart id="Chart" runat="server" Width="568px" Height="344px">
</dotnet:Chart>
</div>
</body>
</html>