Gallery
Pearson
<%@ Page Language="C#" Description="dotnetCHARTING Component" %>
<%@ Register TagPrefix="dotnet" Namespace="dotnetCHARTING" Assembly="dotnetCHARTING"%>
<%@ Import Namespace="System.Drawing" %>
<%@ Import Namespace="System.Drawing.Drawing2D" %>
<html xmlns="http://www.w3.org/1999/xhtml">
<head>
<title>.netCHARTING Sample</title>
<script runat="server">
void Page_Load(Object sender,EventArgs e)
{
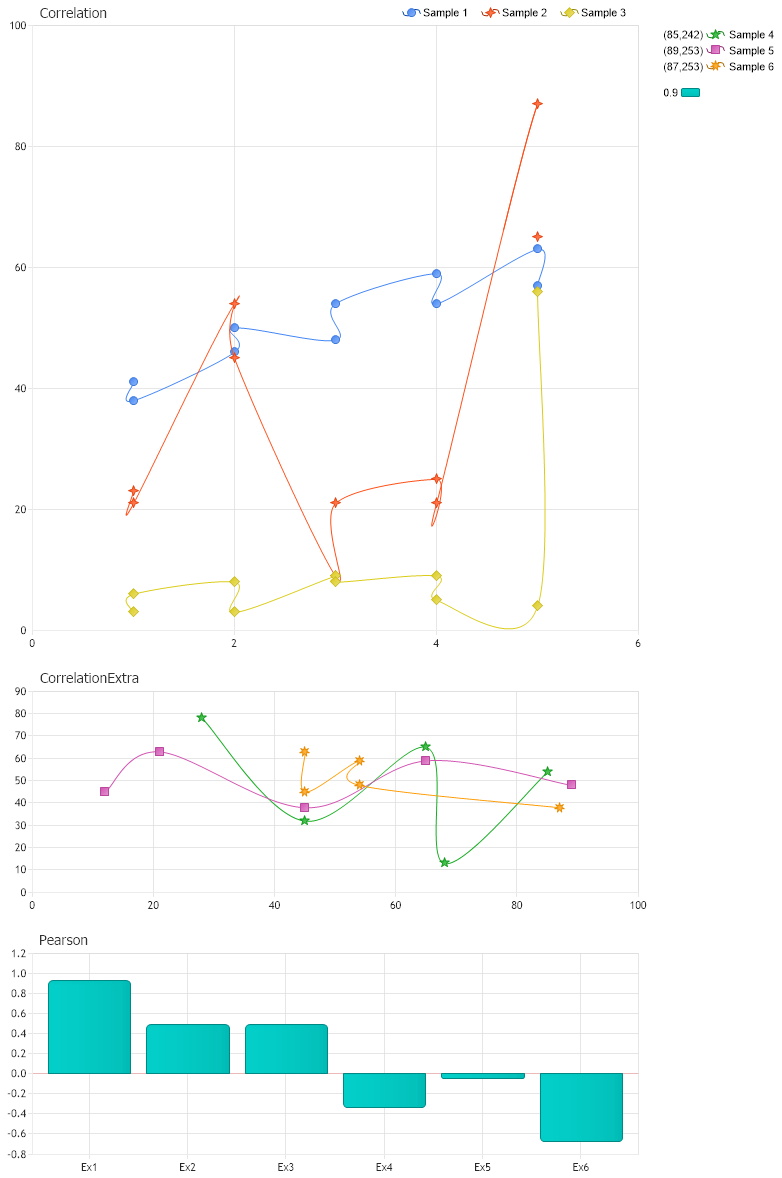
// Demonstrates the use of LeastSquaresRegressionLineX and LeastSquaresRegressionLineY from
// within Correlation class
// The Correlation Chart
CorrelationChart.Title="Correlation";
CorrelationChart.TempDirectory="temp";
CorrelationChart.Debug=true;
CorrelationChart.Size = "800x1200";
CorrelationChart.LegendBox.Template ="%icon %name";
CorrelationChart.XAxis.Scale = Scale.Normal;
CorrelationChart.TitleBox.Position = TitleBoxPosition.FullWithLegend;
CorrelationChart.DefaultSeries.DefaultElement.Marker.Visible = true;
CorrelationChart.DefaultSeries.Type = SeriesType.Spline;
CorrelationChart.ChartAreaLayout.Mode = ChartAreaLayoutMode.Vertical;
// Create a new chart area for Pearson.
ChartArea correlationChartArea = new ChartArea ("CorrelationExtra");
correlationChartArea.HeightPercentage = 20;
correlationChartArea.YAxis = new Axis();
correlationChartArea.XAxis = new Axis();
CorrelationChart.ExtraChartAreas.Add (correlationChartArea);
// Generate the sample data.
SeriesCollection scorrelation = new SeriesCollection();
Series sampledata1 = new Series ("Sample 1");
sampledata1.Elements.Add (new Element("",2.0,50.0));
sampledata1.Elements.Add (new Element("",5.0,57.0));
sampledata1.Elements.Add (new Element("",1.0,41.0));
sampledata1.Elements.Add (new Element("",3.0,54.0));
sampledata1.Elements.Add (new Element("",4.0,54.0));
sampledata1.Elements.Add (new Element("",1.0,38.0));
sampledata1.Elements.Add (new Element("",5.0,63.0));
sampledata1.Elements.Add (new Element("",3.0,48.0));
sampledata1.Elements.Add (new Element("",4.0,59.0));
sampledata1.Elements.Add (new Element("",2.0,46.0));
sampledata1.Sort(ElementValue.XValue,"asc") ;
scorrelation.Add (sampledata1);
Series sampledata2 = new Series ("Sample 2");
sampledata2.Elements.Add (new Element("",2.0,45.0));
sampledata2.Elements.Add (new Element("",5.0,65.0));
sampledata2.Elements.Add (new Element("",1.0,23.0));
sampledata2.Elements.Add (new Element("",3.0,21.0));
sampledata2.Elements.Add (new Element("",4.0,21.0));
sampledata2.Elements.Add (new Element("",1.0,21.0));
sampledata2.Elements.Add (new Element("",5.0,87.0));
sampledata2.Elements.Add (new Element("",3.0,9.0));
sampledata2.Elements.Add (new Element("",4.0,25.0));
sampledata2.Elements.Add (new Element("",2.0,54.0));
sampledata2.Sort(ElementValue.XValue,"asc") ;
scorrelation.Add (sampledata2);
Series sampledata3 = new Series ("Sample 3");
sampledata3.Elements.Add (new Element("",2.0,3.0));
sampledata3.Elements.Add (new Element("",5.0,56.0));
sampledata3.Elements.Add (new Element("",1.0,3.0));
sampledata3.Elements.Add (new Element("",3.0,8.0));
sampledata3.Elements.Add (new Element("",4.0,5.0));
sampledata3.Elements.Add (new Element("",1.0,6.0));
sampledata3.Elements.Add (new Element("",5.0,4.0));
sampledata3.Elements.Add (new Element("",3.0,9.0));
sampledata3.Elements.Add (new Element("",4.0,9.0));
sampledata3.Elements.Add (new Element("",2.0,8.0));
sampledata3.Sort(ElementValue.XValue,"asc") ;
scorrelation.Add (sampledata3);
CorrelationChart.SeriesCollection.Add(scorrelation);
Series sampledata4 = new Series ("Sample 4");
sampledata4.Elements.Add (new Element("",85.0,54.0));
sampledata4.Elements.Add (new Element("",65.0,65.0));
sampledata4.Elements.Add (new Element("",45.0,32.0));
sampledata4.Elements.Add (new Element("",28.0,78.0));
sampledata4.Elements.Add (new Element("",68.0,13.0));
sampledata4.Sort(ElementValue.XValue,"asc") ;
correlationChartArea.SeriesCollection.Add (sampledata4);
Series sampledata5 = new Series ("Sample 5");
sampledata5.Elements.Add (new Element("",45.0,38.0));
sampledata5.Elements.Add (new Element("",21.0,63.0));
sampledata5.Elements.Add (new Element("",89.0,48.0));
sampledata5.Elements.Add (new Element("",65.0,59.0));
sampledata5.Elements.Add (new Element("",12.0,45.0));
sampledata5.Sort(ElementValue.XValue,"asc") ;
correlationChartArea.SeriesCollection.Add (sampledata5);
Series sampledata6 = new Series ("Sample 6");
sampledata6.Elements.Add (new Element("",87.0,38.0));
sampledata6.Elements.Add (new Element("",45.0,63.0));
sampledata6.Elements.Add (new Element("",54.0,48.0));
sampledata6.Elements.Add (new Element("",54.0,59.0));
sampledata6.Elements.Add (new Element("",45.0,45.0));
sampledata6.Sort(ElementValue.XValue,"asc") ;
correlationChartArea.SeriesCollection.Add (sampledata6);
// Create a new chart area for Pearson.
ChartArea pearsonChartArea = new ChartArea ("Pearson");
pearsonChartArea.HeightPercentage = 20;
pearsonChartArea.YAxis = new Axis();
pearsonChartArea.XAxis = new Axis();
CorrelationChart.ExtraChartAreas.Add (pearsonChartArea);
Series pearson = new Series();
pearson.Type = SeriesType.Bar;
Element per1 = StatisticalEngine.PearsonCorrelationCoef("Ex1", sampledata1);
per1.XValue = 1;
pearson.Elements.Add(per1);
Element per2 = StatisticalEngine.PearsonCorrelationCoef("Ex2", sampledata2);
per2.XValue = 2;
pearson.Elements.Add(per2);
Element per3 = StatisticalEngine.PearsonCorrelationCoef("Ex3", sampledata3);
per3.XValue = 3;
pearson.Elements.Add(per3);
Element per4 = StatisticalEngine.PearsonCorrelationCoef("Ex4", sampledata4);
per4.XValue = 4;
pearson.Elements.Add(per4);
Element per5 = StatisticalEngine.PearsonCorrelationCoef("Ex5", sampledata5);
per5.XValue = 5;
pearson.Elements.Add(per5);
Element per6 = StatisticalEngine.PearsonCorrelationCoef("Ex6", sampledata6);
per6.XValue = 6;
pearson.Elements.Add(per6);
pearsonChartArea.SeriesCollection.Add (pearson);
}
</script>
</head>
<body>
<div style="text-align:center">
<dotnet:Chart id="CorrelationChart" runat="server"/>
</div>
</body>
</html>
<%@ Page Language="vb" Description="dotnetCHARTING Component" %>
<%@ Register TagPrefix="dotnet" Namespace="dotnetCHARTING" Assembly="dotnetCHARTING"%>
<%@ Import Namespace="System.Drawing" %>
<%@ Import Namespace="System.Drawing.Drawing2D" %>
<html xmlns="http://www.w3.org/1999/xhtml">
<head>
<title>.netCHARTING Sample</title>
<script runat="server">
Sub Page_Load(ByVal sender As Object, ByVal e As EventArgs)
' Demonstrates the use of LeastSquaresRegressionLineX and LeastSquaresRegressionLineY from
' within Correlation class
' The Correlation Chart
CorrelationChart.Title="Correlation"
CorrelationChart.TempDirectory="temp"
CorrelationChart.Debug=True
CorrelationChart.Size = "800x1200"
CorrelationChart.LegendBox.Template ="%icon %name"
CorrelationChart.XAxis.Scale = Scale.Normal
CorrelationChart.TitleBox.Position = TitleBoxPosition.FullWithLegend
CorrelationChart.DefaultSeries.DefaultElement.Marker.Visible = True
CorrelationChart.DefaultSeries.Type = SeriesType.Spline
CorrelationChart.ChartAreaLayout.Mode = ChartAreaLayoutMode.Vertical
' Create a new chart area for Pearson.
Dim correlationChartArea As ChartArea = New ChartArea ("CorrelationExtra")
correlationChartArea.HeightPercentage = 20
correlationChartArea.YAxis = New Axis()
correlationChartArea.XAxis = New Axis()
CorrelationChart.ExtraChartAreas.Add (correlationChartArea)
' Generate the sample data.
Dim scorrelation As SeriesCollection = New SeriesCollection()
Dim sampledata1 As Series = New Series ("Sample 1")
sampledata1.Elements.Add (New Element("",2.0,50.0))
sampledata1.Elements.Add (New Element("",5.0,57.0))
sampledata1.Elements.Add (New Element("",1.0,41.0))
sampledata1.Elements.Add (New Element("",3.0,54.0))
sampledata1.Elements.Add (New Element("",4.0,54.0))
sampledata1.Elements.Add (New Element("",1.0,38.0))
sampledata1.Elements.Add (New Element("",5.0,63.0))
sampledata1.Elements.Add (New Element("",3.0,48.0))
sampledata1.Elements.Add (New Element("",4.0,59.0))
sampledata1.Elements.Add (New Element("",2.0,46.0))
sampledata1.Sort(ElementValue.XValue,"asc")
scorrelation.Add (sampledata1)
Dim sampledata2 As Series = New Series ("Sample 2")
sampledata2.Elements.Add (New Element("",2.0,45.0))
sampledata2.Elements.Add (New Element("",5.0,65.0))
sampledata2.Elements.Add (New Element("",1.0,23.0))
sampledata2.Elements.Add (New Element("",3.0,21.0))
sampledata2.Elements.Add (New Element("",4.0,21.0))
sampledata2.Elements.Add (New Element("",1.0,21.0))
sampledata2.Elements.Add (New Element("",5.0,87.0))
sampledata2.Elements.Add (New Element("",3.0,9.0))
sampledata2.Elements.Add (New Element("",4.0,25.0))
sampledata2.Elements.Add (New Element("",2.0,54.0))
sampledata2.Sort(ElementValue.XValue,"asc")
scorrelation.Add (sampledata2)
Dim sampledata3 As Series = New Series ("Sample 3")
sampledata3.Elements.Add (New Element("",2.0,3.0))
sampledata3.Elements.Add (New Element("",5.0,56.0))
sampledata3.Elements.Add (New Element("",1.0,3.0))
sampledata3.Elements.Add (New Element("",3.0,8.0))
sampledata3.Elements.Add (New Element("",4.0,5.0))
sampledata3.Elements.Add (New Element("",1.0,6.0))
sampledata3.Elements.Add (New Element("",5.0,4.0))
sampledata3.Elements.Add (New Element("",3.0,9.0))
sampledata3.Elements.Add (New Element("",4.0,9.0))
sampledata3.Elements.Add (New Element("",2.0,8.0))
sampledata3.Sort(ElementValue.XValue,"asc")
scorrelation.Add (sampledata3)
CorrelationChart.SeriesCollection.Add(scorrelation)
Dim sampledata4 As Series = New Series ("Sample 4")
sampledata4.Elements.Add (New Element("",85.0,54.0))
sampledata4.Elements.Add (New Element("",65.0,65.0))
sampledata4.Elements.Add (New Element("",45.0,32.0))
sampledata4.Elements.Add (New Element("",28.0,78.0))
sampledata4.Elements.Add (New Element("",68.0,13.0))
sampledata4.Sort(ElementValue.XValue,"asc")
correlationChartArea.SeriesCollection.Add (sampledata4)
Dim sampledata5 As Series = New Series ("Sample 5")
sampledata5.Elements.Add (New Element("",45.0,38.0))
sampledata5.Elements.Add (New Element("",21.0,63.0))
sampledata5.Elements.Add (New Element("",89.0,48.0))
sampledata5.Elements.Add (New Element("",65.0,59.0))
sampledata5.Elements.Add (New Element("",12.0,45.0))
sampledata5.Sort(ElementValue.XValue,"asc")
correlationChartArea.SeriesCollection.Add (sampledata5)
Dim sampledata6 As Series = New Series ("Sample 6")
sampledata6.Elements.Add (New Element("",87.0,38.0))
sampledata6.Elements.Add (New Element("",45.0,63.0))
sampledata6.Elements.Add (New Element("",54.0,48.0))
sampledata6.Elements.Add (New Element("",54.0,59.0))
sampledata6.Elements.Add (New Element("",45.0,45.0))
sampledata6.Sort(ElementValue.XValue,"asc")
correlationChartArea.SeriesCollection.Add (sampledata6)
' Create a new chart area for Pearson.
Dim pearsonChartArea As ChartArea = New ChartArea ("Pearson")
pearsonChartArea.HeightPercentage = 20
pearsonChartArea.YAxis = New Axis()
pearsonChartArea.XAxis = New Axis()
CorrelationChart.ExtraChartAreas.Add (pearsonChartArea)
Dim pearson As Series = New Series()
pearson.Type = SeriesType.Bar
Dim per1 As Element = StatisticalEngine.PearsonCorrelationCoef("Ex1", sampledata1)
per1.XValue = 1
pearson.Elements.Add(per1)
Dim per2 As Element = StatisticalEngine.PearsonCorrelationCoef("Ex2", sampledata2)
per2.XValue = 2
pearson.Elements.Add(per2)
Dim per3 As Element = StatisticalEngine.PearsonCorrelationCoef("Ex3", sampledata3)
per3.XValue = 3
pearson.Elements.Add(per3)
Dim per4 As Element = StatisticalEngine.PearsonCorrelationCoef("Ex4", sampledata4)
per4.XValue = 4
pearson.Elements.Add(per4)
Dim per5 As Element = StatisticalEngine.PearsonCorrelationCoef("Ex5", sampledata5)
per5.XValue = 5
pearson.Elements.Add(per5)
Dim per6 As Element = StatisticalEngine.PearsonCorrelationCoef("Ex6", sampledata6)
per6.XValue = 6
pearson.Elements.Add(per6)
pearsonChartArea.SeriesCollection.Add (pearson)
End Sub
</script>
</head>
<body>
<div style="text-align:center">
<dotnet:Chart id="CorrelationChart" runat="server"/>
</div>
</body>
</html>
- Sample FilenamePearson.aspx
- VersionLegacy (Pre 3.0)
- Uses DatabaseNo