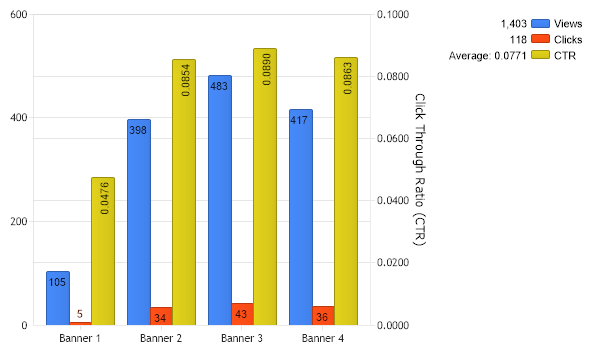
Gallery
Rate Charts
<%@ Page Language="C#" Description="dotnetCHARTING Component" %>
<%@ Register TagPrefix="dotnet" Namespace="dotnetCHARTING" Assembly="dotnetCHARTING"%>
<%@ Import Namespace="System.Drawing" %>
<script runat="server">
void Page_Load(Object sender,EventArgs e)
{
Chart.Type = ChartType.Combo;//Horizontal;
Chart.Width = 600;
Chart.Height = 350;
Chart.TempDirectory = "temp";
// Rate charts can be used to show many interesting stats. For this sample we will make a chart that will show
// click through rates for banner campaigns.
// Lets get our data first. The methods below will generate some random data for us to use.
Series views = getRandomViewsData();
Series clicks = getRandomClicksData();
// Now to get a rate is as easy as this:
Series rate = clicks / views;
// We need a new name for the series
rate.Name = "CTR";
// If we want to show the clicks, views, and rates then we need to create a new y axis because the CTR is so
// small that it will not be readable.
Axis ctrAxis = new Axis("Click Through Ratio (CTR)");
// A new number precision has be to supplied so the numbers can be seen. Otherwise we will see only 0s on the axis.
ctrAxis.NumberPrecision = 4;
// Lets move it on the right side also
ctrAxis.Orientation = dotnetCHARTING.Orientation.Right;
// Now to assign the ctr axis to the ctr series:
rate.YAxis = ctrAxis;
// In the legend the values are sums by default and that does not make sense for CTR so lets
// make the value in the legend an average for the ctr series.
rate.LegendEntry.Value = "Average: %YAverage";
// Show values on bars
Chart.DefaultSeries.DefaultElement.ShowValue = true;
// Add the data.
Chart.SeriesCollection.Add(views);
Chart.SeriesCollection.Add(clicks);
Chart.SeriesCollection.Add(rate);
}
Series getRandomViewsData() // This method will generate a series representing views for our banners
{
Random myR = new Random();
Series s = new Series();
s.Name = "Views";
for(int b = 1; b < 5; b++)
{
Element e = new Element();
e.Name = "Banner " + b;;
e.YValue = 50 + myR.Next(500);
s.Elements.Add(e);
}
return s;
}
Series getRandomClicksData() // This method will generate a series representing clicks for our banners
{
Random myR = new Random();
Series s = new Series();
s.Name = "Clicks";
for(int b = 1; b < 5; b++)
{
Element e = new Element();
e.Name = "Banner " + b;;
e.YValue = myR.Next(50);
s.Elements.Add(e);
}
return s;
}
</script>
<html xmlns="http://www.w3.org/1999/xhtml"><head><title>Rate chart</title></head>
<body>
<div style="text-align:center">
<dotnet:Chart id="Chart" runat="server"/>
</div>
</body>
</html>
<%@ Page Language="vb" Description="dotnetCHARTING Component" %>
<%@ Register TagPrefix="dotnet" Namespace="dotnetCHARTING" Assembly="dotnetCHARTING"%>
<%@ Import Namespace="System.Drawing" %>
<script runat="server">
Sub Page_Load(ByVal sender As Object, ByVal e As EventArgs)
Chart.Type = ChartType.Combo 'Horizontal;
Chart.Width = 600
Chart.Height = 350
Chart.TempDirectory = "temp"
' Rate charts can be used to show many interesting stats. For this sample we will make a chart that will show
' click through rates for banner campaigns.
' Lets get our data first. The methods below will generate some random data for us to use.
Dim views As Series = getRandomViewsData()
Dim clicks As Series = getRandomClicksData()
' Now to get a rate is as easy as this:
Dim rate As Series = clicks / views
' We need a new name for the series
rate.Name = "CTR"
' If we want to show the clicks, views, and rates then we need to create a new y axis because the CTR is so
' small that it will not be readable.
Dim ctrAxis As Axis = New Axis("Click Through Ratio (CTR)")
' A new number precision has be to supplied so the numbers can be seen. Otherwise we will see only 0s on the axis.
ctrAxis.NumberPrecision = 4
' Lets move it on the right side also
ctrAxis.Orientation = dotnetCHARTING.Orientation.Right
' Now to assign the ctr axis to the ctr series:
rate.YAxis = ctrAxis
' In the legend the values are sums by default and that does not make sense for CTR so lets
' make the value in the legend an average for the ctr series.
rate.LegendEntry.Value = "Average: %YAverage"
' Show values on bars
Chart.DefaultSeries.DefaultElement.ShowValue = True
' Add the data.
Chart.SeriesCollection.Add(views)
Chart.SeriesCollection.Add(clicks)
Chart.SeriesCollection.Add(rate)
End Sub
Function getRandomViewsData() As Series ' This method will generate a series representing views for our banners
Dim myR As Random = New Random()
Dim s As Series = New Series()
s.Name = "Views"
For b As Integer = 1 To 4
Dim e As Element = New Element()
e.Name = "Banner " & b
e.YValue = 50 + myR.Next(500)
s.Elements.Add(e)
Next b
Return s
End Function
Function getRandomClicksData() As Series ' This method will generate a series representing clicks for our banners
Dim myR As Random = New Random()
Dim s As Series = New Series()
s.Name = "Clicks"
For b As Integer = 1 To 4
Dim e As Element = New Element()
e.Name = "Banner " & b
e.YValue = myR.Next(50)
s.Elements.Add(e)
Next b
Return s
End Function
</script>
<html xmlns="http://www.w3.org/1999/xhtml"><head><title>Rate chart</title></head>
<body>
<div style="text-align:center">
<dotnet:Chart id="Chart" runat="server"/>
</div>
</body>
</html>
- Sample FilenameRateCharts.aspx
- VersionLegacy (Pre 3.0)
- Uses DatabaseNo