Residuals
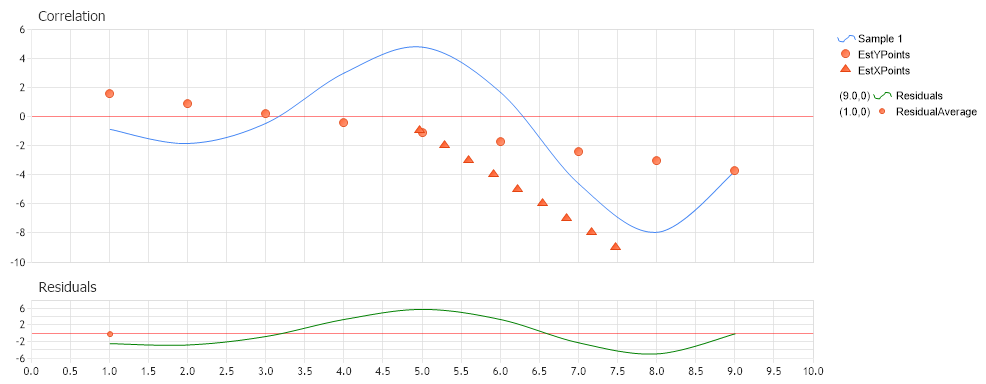
Demonstrates the use of LeastSquaresRegressionLineX and LeastSquaresRegressionLineY from within Correlation class.
<%@ Page Language="C#" Description="dotnetCHARTING Component" %>
<%@ Register TagPrefix="dotnet" Namespace="dotnetCHARTING" Assembly="dotnetCHARTING"%>
<%@ Import Namespace="System.Drawing" %>
<html xmlns="http://www.w3.org/1999/xhtml">
<head>
<title>.netCHARTING Residuals Sample</title>
<script runat="server">
void Page_Load(Object sender,EventArgs e)
{
// Demonstrates the use of EstimateX and EstimateY from
// within Correlation class
// The Correlation Chart
CorrelationChart.Title="Correlation";
CorrelationChart.TempDirectory="temp";
CorrelationChart.Debug=true;
CorrelationChart.Size = "1000x400";
CorrelationChart.LegendBox.Template ="%icon %name";
CorrelationChart.XAxis.Scale = Scale.Normal;
CorrelationChart.YAxis.ZeroTick.GridLine.Color = Color.FromArgb(125, 255, 0, 0);
SeriesCollection scorrelation = new SeriesCollection();
Series sampledata1 = new Series ("Sample 1");
for ( int b=1; b<10; b++) {
Element el = new Element();
el.YValue = -Math.Sin(b)* b;
el.XValue = b ;
sampledata1.Elements.Add (el);
}
scorrelation.Add (sampledata1);
scorrelation[0].Type = SeriesType.Spline;
CorrelationChart.SeriesCollection.Add (scorrelation);
/*
* Takes off the marker off the line and spline series.
*/
CorrelationChart.DefaultSeries.DefaultElement.Marker = new ElementMarker (ElementMarkerType.None);
// Here we create a series which will hold
// the estimated value of the Y variable when the X variable is known
Series estYPoints = new Series();
for (int i = 1; i < 10; i++){
Element estY = StatisticalEngine.EstimateY(sampledata1,i);
estYPoints.Elements.Add(estY);
}
estYPoints.Name = "EstYPoints";
estYPoints.DefaultElement.Color = Color.FromArgb(255,99,49);
estYPoints.DefaultElement.Marker = new ElementMarker (ElementMarkerType.Circle);
estYPoints.Type = SeriesType.Marker;
CorrelationChart.SeriesCollection.Add(estYPoints);
// Here we create a series which will hold
// the estimated value of the X variable when the Y variable is known
Series estXPoints = new Series();
for (int i = 1; i < 10; i++){
Element estX = StatisticalEngine.EstimateX(sampledata1,-i);
estXPoints.Elements.Add(estX);
}
estXPoints.Name = "EstXPoints";
estXPoints.DefaultElement.Marker = new ElementMarker (ElementMarkerType.Triangle);
estXPoints.Type = SeriesType.Marker;
CorrelationChart.SeriesCollection.Add(estXPoints);
ChartArea residualsChartArea = new ChartArea ("Residuals");
residualsChartArea.HeightPercentage = 20;
residualsChartArea.YAxis.ZeroTick.GridLine.Color = Color.FromArgb(125, 255, 0, 0);
CorrelationChart.ExtraChartAreas.Add (residualsChartArea);
// Here we create a series which display the residuals
// in accordance with the regression line constructed using LeastSquaresRegressionLineX
Series residuals = StatisticalEngine.Residuals(sampledata1);
residuals.Type = SeriesType.Spline;
residuals.Name = "Residuals";
residuals.DefaultElement.Color = Color.Green;
residualsChartArea.SeriesCollection.Add (residuals);
// Here we calculate the residual Average Of the data sample
Element residualAvg = StatisticalEngine.ResidualsAverage(sampledata1);
residualAvg.XValue = 1;
Series resAvg = new Series();
resAvg.Type = SeriesType.Marker;
resAvg.DefaultElement.Marker = new ElementMarker (ElementMarkerType.Circle, 5, Color.FromArgb(255, 99, 49));
resAvg.Name = "ResidualAverage";
if (residualAvg.YValue == 0)
Console.WriteLine ("The residuals average is 0.");
else
{
resAvg.Elements.Add(residualAvg);
resAvg.DefaultElement.Color = Color.FromArgb(99,255,49);
residualsChartArea.SeriesCollection.Add(resAvg);
}
}
</script>
</head>
<body>
<div style="text-align:center">
<dotnet:Chart id="CorrelationChart" runat="server"/>
</div>
</body>
</html>
<%@ Page Language="vb" Description="dotnetCHARTING Component" %>
<%@ Register TagPrefix="dotnet" Namespace="dotnetCHARTING" Assembly="dotnetCHARTING"%>
<%@ Import Namespace="System.Drawing" %>
<html xmlns="http://www.w3.org/1999/xhtml">
<head>
<title>.netCHARTING Residuals Sample</title>
<script runat="server">
Sub Page_Load(ByVal sender As Object, ByVal e As EventArgs)
' Demonstrates the use of EstimateX and EstimateY from
' within Correlation class
' The Correlation Chart
CorrelationChart.Title="Correlation"
CorrelationChart.TempDirectory="temp"
CorrelationChart.Debug=True
CorrelationChart.Size = "1000x400"
CorrelationChart.LegendBox.Template ="%icon %name"
CorrelationChart.XAxis.Scale = Scale.Normal
CorrelationChart.YAxis.ZeroTick.GridLine.Color = Color.FromArgb(125, 255, 0, 0)
Dim scorrelation As SeriesCollection = New SeriesCollection()
Dim sampledata1 As Series = New Series ("Sample 1")
For b As Integer = 1 To 9
Dim el As Element = New Element()
el.YValue = -Math.Sin(b)* b
el.XValue = b
sampledata1.Elements.Add (el)
Next b
scorrelation.Add (sampledata1)
scorrelation(0).Type = SeriesType.Spline
CorrelationChart.SeriesCollection.Add (scorrelation)
'
'* Takes off the marker off the line and spline series.
'
CorrelationChart.DefaultSeries.DefaultElement.Marker = New ElementMarker (ElementMarkerType.None)
' Here we create a series which will hold
' the estimated value of the Y variable when the X variable is known
Dim estYPoints As Series = New Series()
For i As Integer = 1 To 9
Dim estY As Element = StatisticalEngine.EstimateY(sampledata1,i)
estYPoints.Elements.Add(estY)
Next i
estYPoints.Name = "EstYPoints"
estYPoints.DefaultElement.Color = Color.FromArgb(255,99,49)
estYPoints.DefaultElement.Marker = New ElementMarker (ElementMarkerType.Circle)
estYPoints.Type = SeriesType.Marker
CorrelationChart.SeriesCollection.Add(estYPoints)
' Here we create a series which will hold
' the estimated value of the X variable when the Y variable is known
Dim estXPoints As Series = New Series()
For i As Integer = 1 To 9
Dim estX As Element = StatisticalEngine.EstimateX(sampledata1,-i)
estXPoints.Elements.Add(estX)
Next i
estXPoints.Name = "EstXPoints"
estXPoints.DefaultElement.Marker = New ElementMarker (ElementMarkerType.Triangle)
estXPoints.Type = SeriesType.Marker
CorrelationChart.SeriesCollection.Add(estXPoints)
Dim residualsChartArea As ChartArea = New ChartArea ("Residuals")
residualsChartArea.HeightPercentage = 20
residualsChartArea.YAxis.ZeroTick.GridLine.Color = Color.FromArgb(125, 255, 0, 0)
CorrelationChart.ExtraChartAreas.Add (residualsChartArea)
' Here we create a series which display the residuals
' in accordance with the regression line constructed using LeastSquaresRegressionLineX
Dim residuals As Series = StatisticalEngine.Residuals(sampledata1)
residuals.Type = SeriesType.Spline
residuals.Name = "Residuals"
residuals.DefaultElement.Color = Color.Green
residualsChartArea.SeriesCollection.Add (residuals)
' Here we calculate the residual Average Of the data sample
Dim residualAvg As Element = StatisticalEngine.ResidualsAverage(sampledata1)
residualAvg.XValue = 1
Dim resAvg As Series = New Series()
resAvg.Type = SeriesType.Marker
resAvg.DefaultElement.Marker = New ElementMarker (ElementMarkerType.Circle, 5, Color.FromArgb(255, 99, 49))
resAvg.Name = "ResidualAverage"
If residualAvg.YValue = 0 Then
Console.WriteLine ("The residuals average is 0.")
Else
resAvg.Elements.Add(residualAvg)
resAvg.DefaultElement.Color = Color.FromArgb(99,255,49)
residualsChartArea.SeriesCollection.Add(resAvg)
End If
End Sub
</script>
</head>
<body>
<div style="text-align:center">
<dotnet:Chart id="CorrelationChart" runat="server"/>
</div>
</body>
</html>