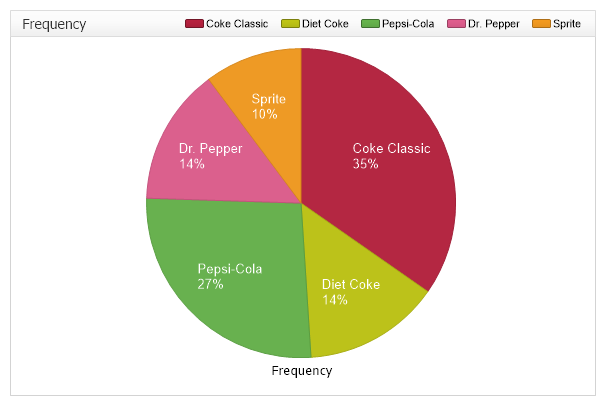
Soft Drinks Histogram
Demonstrates the use of statistical procedures for summarize quantitative data from within StatisticalEngine.
<%@ Page Language="C#" Description="dotnetCHARTING Component" %>
<%@ Register TagPrefix="dotnet" Namespace="dotnetCHARTING" Assembly="dotnetCHARTING"%>
<%@ Import Namespace="System.Drawing" %>
<%@ Import Namespace="System.Drawing.Drawing2D" %>
<%@ Import Namespace="dotnetCHARTING"%>
<html xmlns="http://www.w3.org/1999/xhtml">
<head>
<title>.netCHARTING Sample</title>
<script runat="server">
void Page_Load(Object sender,EventArgs e)
{
// Demonstrates the use of statistical procedures for summarize quantitative data from
// within StatisticalEngine.
// In this example we use the RelativeTableFrequency to calculate the percentage
// of the types of soft drink purchases.
// The Histogram Chart
HistogramChart.Title=" Frequency";
HistogramChart.Type = ChartType.Pies;
HistogramChart.PieLabelMode = PieLabelMode.Inside;
HistogramChart.TempDirectory = "temp";
HistogramChart.Debug=false;
HistogramChart.Size = "600x400";
HistogramChart.LegendBox.Template ="%icon %Name";
HistogramChart.XAxis.Scale = Scale.Normal;
HistogramChart.TitleBox.Position = TitleBoxPosition.FullWithLegend;
HistogramChart.TitleBox.CornerTopLeft = BoxCorner.Square;
HistogramChart.ChartArea.Line = new Line(Color.LightGray, 1);
HistogramChart.PaletteName = Palette.Three;
string[] softDrinks = new string[] {"Coke Classic","Diet Coke","Pepsi-Cola","Diet Coke","Coke Classic",
"Coke Classic","Dr. Pepper","Diet Coke","Pepsi-Cola","Pepsi-Cola",
"Coke Classic","Dr. Pepper","Sprite","Coke Classic","Coke Classic",
"Sprite","Coke Classic","Diet Coke","Coke Classic","Diet Coke",
"Coke Classic","Sprite","Pepsi-Cola","Dr. Pepper","Coke Classic",
"Coke Classic","Pepsi-Cola","Coke Classic","Sprite","Dr. Pepper",
"Pepsi-Cola","Diet Coke","Pepsi-Cola","Coke Classic","Coke Classic",
"Coke Classic","Pepsi-Cola","Dr. Pepper","Coke Classic","Diet Coke",
"Pepsi-Cola","Pepsi-Cola","Pepsi-Cola","Pepsi-Cola","Coke Classic",
"Dr. Pepper","Dr. Pepper","Pepsi-Cola","Sprite"};
Series sampledata = new Series ("SoftDrinks");
for ( int i=0; i < softDrinks.Length; i++) {
Element el = new Element();
switch (softDrinks[i]) {
case "Coke Classic": el.YValue = 1; el.Name = softDrinks[i];break;
case "Diet Coke": el.YValue = 2; el.Name = softDrinks[i];break;
case "Pepsi-Cola": el.YValue = 3; el.Name = softDrinks[i];break;
case "Dr. Pepper": el.YValue = 4; el.Name = softDrinks[i];break;
case "Sprite": el.YValue = 5; el.Name = softDrinks[i];break;
}
sampledata.Elements.Add (el);
}
// CFrequencyTableAOL - Calculates the relative frequency table from above for a discrete data set
// in accordance with the open left boundary (OLB) convention.
Series relativeFreqSeries = StatisticalEngine.RFrequencyTableOL("Frequency", sampledata, new double[] {1,2,3,4,5});
relativeFreqSeries.Elements[0].Name = "Coke Classic";
relativeFreqSeries.Elements[1].Name = "Diet Coke";
relativeFreqSeries.Elements[2].Name = "Pepsi-Cola";
relativeFreqSeries.Elements[3].Name = "Dr. Pepper";
relativeFreqSeries.Elements[4].Name = "Sprite";
relativeFreqSeries.DefaultElement.LabelTemplate = "%name\n%yPercentOfTotal";
relativeFreqSeries.DefaultElement.SmartLabel.Color=Color.White;
relativeFreqSeries.DefaultElement.SmartLabel.Font = new Font("Arial", 10);
relativeFreqSeries.DefaultElement.ShowValue = true;
HistogramChart.SeriesCollection.Add(relativeFreqSeries);
}
</script>
</head>
<body>
<div style="text-align:center">
<dotnet:Chart id="HistogramChart" runat="server"/>
</div>
</body>
</html>
<%@ Page Language="vb" Description="dotnetCHARTING Component" %>
<%@ Register TagPrefix="dotnet" Namespace="dotnetCHARTING" Assembly="dotnetCHARTING"%>
<%@ Import Namespace="System.Drawing" %>
<%@ Import Namespace="System.Drawing.Drawing2D" %>
<%@ Import Namespace="dotnetCHARTING"%>
<html xmlns="http://www.w3.org/1999/xhtml">
<head>
<title>.netCHARTING Sample</title>
<script runat="server">
Sub Page_Load(ByVal sender As Object, ByVal e As EventArgs)
' Demonstrates the use of statistical procedures for summarize quantitative data from
' within StatisticalEngine.
' In this example we use the RelativeTableFrequency to calculate the percentage
' of the types of soft drink purchases.
' The Histogram Chart
HistogramChart.Title=" Frequency"
HistogramChart.Type = ChartType.Pies
HistogramChart.PieLabelMode = PieLabelMode.Inside
HistogramChart.TempDirectory = "temp"
HistogramChart.Debug=False
HistogramChart.Size = "600x400"
HistogramChart.LegendBox.Template ="%icon %Name"
HistogramChart.XAxis.Scale = Scale.Normal
HistogramChart.TitleBox.Position = TitleBoxPosition.FullWithLegend
HistogramChart.TitleBox.CornerTopLeft = BoxCorner.Square
HistogramChart.ChartArea.Line = New Line(Color.LightGray, 1)
HistogramChart.PaletteName = Palette.Three
Dim softDrinks As String() = New String() {"Coke Classic","Diet Coke","Pepsi-Cola","Diet Coke","Coke Classic", "Coke Classic","Dr. Pepper","Diet Coke","Pepsi-Cola","Pepsi-Cola", "Coke Classic","Dr. Pepper","Sprite","Coke Classic","Coke Classic", "Sprite","Coke Classic","Diet Coke","Coke Classic","Diet Coke", "Coke Classic","Sprite","Pepsi-Cola","Dr. Pepper","Coke Classic", "Coke Classic","Pepsi-Cola","Coke Classic","Sprite","Dr. Pepper", "Pepsi-Cola","Diet Coke","Pepsi-Cola","Coke Classic","Coke Classic", "Coke Classic","Pepsi-Cola","Dr. Pepper","Coke Classic","Diet Coke", "Pepsi-Cola","Pepsi-Cola","Pepsi-Cola","Pepsi-Cola","Coke Classic", "Dr. Pepper","Dr. Pepper","Pepsi-Cola","Sprite"}
Dim sampledata As Series = New Series ("SoftDrinks")
For i As Integer = 0 To softDrinks.Length - 1
Dim el As Element = New Element()
Select Case softDrinks(i)
Case "Coke Classic"
el.YValue = 1
el.Name = softDrinks(i)
Case "Diet Coke"
el.YValue = 2
el.Name = softDrinks(i)
Case "Pepsi-Cola"
el.YValue = 3
el.Name = softDrinks(i)
Case "Dr. Pepper"
el.YValue = 4
el.Name = softDrinks(i)
Case "Sprite"
el.YValue = 5
el.Name = softDrinks(i)
End Select
sampledata.Elements.Add (el)
Next i
' CFrequencyTableAOL - Calculates the relative frequency table from above for a discrete data set
' in accordance with the open left boundary (OLB) convention.
Dim relativeFreqSeries As Series = StatisticalEngine.RFrequencyTableOL("Frequency", sampledata, New Double() {1,2,3,4,5})
relativeFreqSeries.Elements(0).Name = "Coke Classic"
relativeFreqSeries.Elements(1).Name = "Diet Coke"
relativeFreqSeries.Elements(2).Name = "Pepsi-Cola"
relativeFreqSeries.Elements(3).Name = "Dr. Pepper"
relativeFreqSeries.Elements(4).Name = "Sprite"
relativeFreqSeries.DefaultElement.LabelTemplate = "%name" & Constants.vbLf & "%yPercentOfTotal"
relativeFreqSeries.DefaultElement.SmartLabel.Color=Color.White
relativeFreqSeries.DefaultElement.SmartLabel.Font = New Font("Arial", 10)
relativeFreqSeries.DefaultElement.ShowValue = True
HistogramChart.SeriesCollection.Add(relativeFreqSeries)
End Sub
</script>
</head>
<body>
<div style="text-align:center">
<dotnet:Chart id="HistogramChart" runat="server"/>
</div>
</body>
</html>