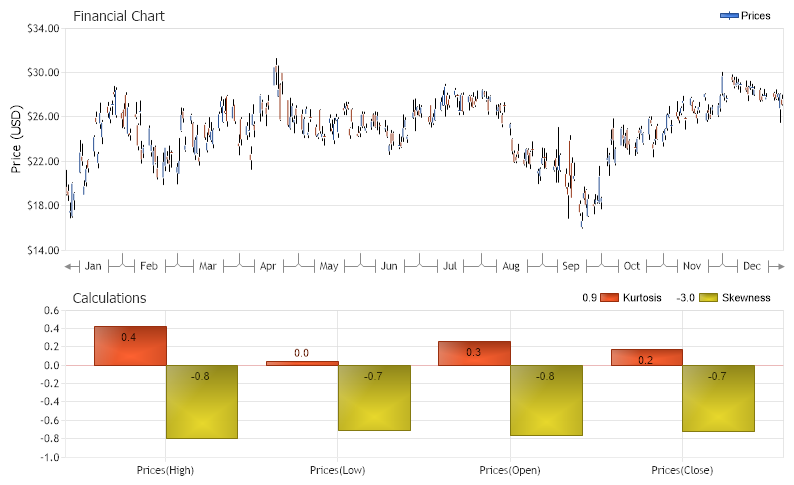
Financial Kurtosis Indicator
Demonstrates the use of one-value financial indicators kurtosis and skewness.
<%@ Page Language="C#" Description="dotnetCHARTING Component" %>
<%@ Register TagPrefix="dotnet" Namespace="dotnetCHARTING" Assembly="dotnetCHARTING"%>
<%@ Import Namespace="System.Drawing" %>
<%@ Import Namespace="System.Drawing.Drawing2D" %>
<%@ Import Namespace="dotnetCHARTING"%>
<html xmlns="http://www.w3.org/1999/xhtml">
<head>
<title>.netCHARTING Sample</title>
<script runat="server">
void Page_Load(Object sender,EventArgs e)
{
// Demonstrates the use of one-value financial indicators kurtosis and skewness.
// The Financial Chart
FinancialChart.Title="Financial Chart";
FinancialChart.TempDirectory="temp";
FinancialChart.Debug=true;
FinancialChart.ShadingEffect = true;
FinancialChart.LegendBox.Template ="%icon %name";
FinancialChart.Size="800X500";
FinancialChart.YAxis.Label.Text = "Price (USD)";
FinancialChart.YAxis.FormatString = "currency";
FinancialChart.YAxis.Scale = Scale.Range;
FinancialChart.TitleBox.Position = TitleBoxPosition.FullWithLegend;
FinancialChart.DefaultTitleBox.Position = TitleBoxPosition.FullWithLegend;
// Modify the x axis labels.
FinancialChart.XAxis.Scale = Scale.Time;
FinancialChart.XAxis.TimeScaleLabels.RangeIntervals.Add(TimeInterval.Month);
FinancialChart.XAxis.TimeScaleLabels.MonthFormatString = "MMM";
FinancialChart.XAxis.TimeScaleLabels.Mode = TimeScaleLabelMode.Hidden;
DataEngine priceDataEngine = new DataEngine ();
priceDataEngine.ChartObject = FinancialChart;
priceDataEngine.ChartType = ChartType.Financial;
priceDataEngine.ConnectionString = ConfigurationManager.AppSettings["DNCConnectionString"];
priceDataEngine.DateGrouping = TimeInterval.Day;
priceDataEngine.StartDate = new DateTime (2021,1,1);
priceDataEngine.EndDate = new DateTime (2021,12,31);
// Here we import financial data sample from the FinancialCompany table from within chartsample.mdb
priceDataEngine.SqlStatement = @"SELECT TransDate, HighPrice, LowPrice, OpenPrice, ClosePrice FROM FinancialCompany WHERE TransDate >= #STARTDATE# AND TransDate <= #ENDDATE# ORDER BY TransDate";
priceDataEngine.DataFields = "xAxis=TransDate,High=HighPrice,Low=LowPrice,Open=OpenPrice,Close=ClosePrice";
SeriesCollection sc = priceDataEngine.GetSeries ();
Series prices = null;
if(sc.Count>0)
prices = sc[0];
else
return;
prices.Type = SeriesTypeFinancial.CandleStick;
CalendarPattern cp = new CalendarPattern (TimeInterval.Day, TimeInterval.Week, "0000001");
prices.Trim (cp, ElementValue.XDateTime);
prices.Name = "Prices";
FinancialChart.SeriesCollection.Add (prices);
FinancialChart.ChartAreaLayout.Mode = ChartAreaLayoutMode.Vertical;
/*
* One-Value Indicators
*/
ChartArea indicatorsChartArea = new ChartArea ("Calculations");
indicatorsChartArea.XAxis = new Axis ();
indicatorsChartArea.YAxis = new Axis ();
indicatorsChartArea.HeightPercentage = 40;
indicatorsChartArea.DefaultElement.ShowValue = true;
FinancialChart.ExtraChartAreas.Add (indicatorsChartArea);
// Kurtosis - calculates the Kurtosis of the currently registered data set.
Series kurtosis = new Series ("Kurtosis");
// If this option is setted true it will allow the user to place all the source values
// into the element�s subValues collection
FinancialEngine.Options.PopulateSubValues = false;
kurtosis.Elements.Add (FinancialEngine.Kurtosis (prices, ElementValue.High));
kurtosis.Elements.Add (FinancialEngine.Kurtosis (prices, ElementValue.Low));
kurtosis.Elements.Add (FinancialEngine.Kurtosis (prices, ElementValue.Open));
kurtosis.Elements.Add (FinancialEngine.Kurtosis (prices, ElementValue.Close));
kurtosis.Type = SeriesType.Bar;
indicatorsChartArea.SeriesCollection.Add (kurtosis);
// Skewness - calculates the skewness of the currently registered data set.
Series skewness = new Series ("Skewness");
skewness.Elements.Add (FinancialEngine.Skewness (prices, ElementValue.High));
skewness.Elements.Add (FinancialEngine.Skewness (prices, ElementValue.Low));
skewness.Elements.Add (FinancialEngine.Skewness (prices, ElementValue.Open));
skewness.Elements.Add (FinancialEngine.Skewness (prices, ElementValue.Close));
skewness.Type = SeriesType.Bar;
indicatorsChartArea.SeriesCollection.Add (skewness);
}
</script>
</head>
<body>
<div style="text-align:center">
<dotnet:Chart id="FinancialChart" runat="server"/>
</div>
</body>
</html>
<%@ Page Language="vb" Description="dotnetCHARTING Component" %>
<%@ Register TagPrefix="dotnet" Namespace="dotnetCHARTING" Assembly="dotnetCHARTING"%>
<%@ Import Namespace="System.Drawing" %>
<%@ Import Namespace="System.Drawing.Drawing2D" %>
<%@ Import Namespace="dotnetCHARTING"%>
<html xmlns="http://www.w3.org/1999/xhtml">
<head>
<title>.netCHARTING Sample</title>
<script runat="server">
Sub Page_Load(ByVal sender As Object, ByVal e As EventArgs)
' Demonstrates the use of one-value financial indicators kurtosis and skewness.
' The Financial Chart
FinancialChart.Title="Financial Chart"
FinancialChart.TempDirectory="temp"
FinancialChart.Debug=True
FinancialChart.ShadingEffect = True
FinancialChart.LegendBox.Template ="%icon %name"
FinancialChart.Size="800X500"
FinancialChart.YAxis.Label.Text = "Price (USD)"
FinancialChart.YAxis.FormatString = "currency"
FinancialChart.YAxis.Scale = Scale.Range
FinancialChart.TitleBox.Position = TitleBoxPosition.FullWithLegend
FinancialChart.DefaultTitleBox.Position = TitleBoxPosition.FullWithLegend
' Modify the x axis labels.
FinancialChart.XAxis.Scale = Scale.Time
FinancialChart.XAxis.TimeScaleLabels.RangeIntervals.Add(TimeInterval.Month)
FinancialChart.XAxis.TimeScaleLabels.MonthFormatString = "MMM"
FinancialChart.XAxis.TimeScaleLabels.Mode = TimeScaleLabelMode.Hidden
Dim priceDataEngine As DataEngine = New DataEngine ()
priceDataEngine.ChartObject = FinancialChart
priceDataEngine.ChartType = ChartType.Financial
priceDataEngine.ConnectionString = ConfigurationManager.AppSettings("DNCConnectionString")
priceDataEngine.DateGrouping = TimeInterval.Day
priceDataEngine.StartDate = New DateTime (2021,1,1)
priceDataEngine.EndDate = New DateTime (2021,12,31)
' Here we import financial data sample from the FinancialCompany table from within chartsample.mdb
priceDataEngine.SqlStatement = "SELECT TransDate, HighPrice, LowPrice, OpenPrice, ClosePrice FROM FinancialCompany WHERE TransDate >= #STARTDATE# AND TransDate <= #ENDDATE# ORDER BY TransDate"
priceDataEngine.DataFields = "xAxis=TransDate,High=HighPrice,Low=LowPrice,Open=OpenPrice,Close=ClosePrice"
Dim sc As SeriesCollection = priceDataEngine.GetSeries ()
Dim prices As Series = Nothing
If sc.Count>0 Then
prices = sc(0)
Else
Return
End If
prices.Type = SeriesTypeFinancial.CandleStick
Dim cp As CalendarPattern = New CalendarPattern (TimeInterval.Day, TimeInterval.Week, "0000001")
prices.Trim (cp, ElementValue.XDateTime)
prices.Name = "Prices"
FinancialChart.SeriesCollection.Add (prices)
FinancialChart.ChartAreaLayout.Mode = ChartAreaLayoutMode.Vertical
'
'* One-Value Indicators
'
Dim indicatorsChartArea As ChartArea = New ChartArea ("Calculations")
indicatorsChartArea.XAxis = New Axis ()
indicatorsChartArea.YAxis = New Axis ()
indicatorsChartArea.HeightPercentage = 40
indicatorsChartArea.DefaultElement.ShowValue = True
FinancialChart.ExtraChartAreas.Add (indicatorsChartArea)
' Kurtosis - calculates the Kurtosis of the currently registered data set.
Dim kurtosis As Series = New Series ("Kurtosis")
' If this option is setted true it will allow the user to place all the source values
' into the element�s subValues collection
FinancialEngine.Options.PopulateSubValues = False
kurtosis.Elements.Add (FinancialEngine.Kurtosis (prices, ElementValue.High))
kurtosis.Elements.Add (FinancialEngine.Kurtosis (prices, ElementValue.Low))
kurtosis.Elements.Add (FinancialEngine.Kurtosis (prices, ElementValue.Open))
kurtosis.Elements.Add (FinancialEngine.Kurtosis (prices, ElementValue.Close))
kurtosis.Type = SeriesType.Bar
indicatorsChartArea.SeriesCollection.Add (kurtosis)
' Skewness - calculates the skewness of the currently registered data set.
Dim skewness As Series = New Series ("Skewness")
skewness.Elements.Add (FinancialEngine.Skewness (prices, ElementValue.High))
skewness.Elements.Add (FinancialEngine.Skewness (prices, ElementValue.Low))
skewness.Elements.Add (FinancialEngine.Skewness (prices, ElementValue.Open))
skewness.Elements.Add (FinancialEngine.Skewness (prices, ElementValue.Close))
skewness.Type = SeriesType.Bar
indicatorsChartArea.SeriesCollection.Add (skewness)
End Sub
</script>
</head>
<body>
<div style="text-align:center">
<dotnet:Chart id="FinancialChart" runat="server"/>
</div>
</body>
</html>