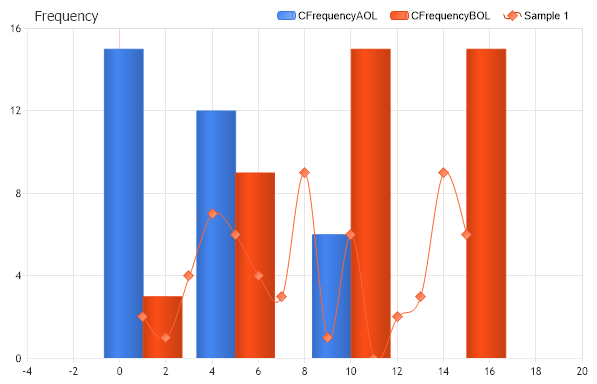
Gallery
Frequency Table
<%@ Page Language="C#" Description="dotnetCHARTING Component" %>
<%@ Register TagPrefix="dotnet" Namespace="dotnetCHARTING" Assembly="dotnetCHARTING"%>
<%@ Import Namespace="System.Drawing" %>
<%@ Import Namespace="System.Drawing.Drawing2D" %>
<html xmlns="http://www.w3.org/1999/xhtml">
<head>
<title>.netCHARTING Sample</title>
<script runat="server">
void Page_Load(Object sender,EventArgs e)
{
// Demonstrates the use of statistical procedures for summarize quantitative data from
// within DataPresentation class from within WebCab.Statistics module.
// The Correlation Chart
CorrelationChart.Title="Frequency";
CorrelationChart.TempDirectory = "temp";
CorrelationChart.Debug=true;
CorrelationChart.Size = "600x400";
CorrelationChart.LegendBox.Template ="%icon %name";
CorrelationChart.XAxis.Scale = Scale.Normal;
CorrelationChart.TitleBox.Position = TitleBoxPosition.FullWithLegend;
CorrelationChart.DefaultSeries.Type = SeriesType.Cylinder;
Random myR = new Random(1);
SeriesCollection scorrelation = new SeriesCollection();
Series sampledata1 = new Series ("Sample 1");
for ( int a=1; a<=15; a++) {
Element el = new Element();
el.YValue = myR.Next(10);
el.XValue = a ;
sampledata1.Elements.Add (el);
}
scorrelation.Add (sampledata1);
scorrelation[0].Type = SeriesType.Spline;
scorrelation[0].DefaultElement.Color = Color.FromArgb(255,99,49);
// CFrequencyTableAOL - Calculates the cumulative frequency table from above for a discrete data set
// in accordance with the open left boundary (OLB) convention.
Series ftableAOL = StatisticalEngine.CFrequencyTableAOL("CFrequencyAOL",sampledata1, new double[] {1,5,10,15});
CorrelationChart.SeriesCollection.Add(ftableAOL);
// CFrequencyTableBOL - Calculates the cumulative frequency table from below for a discrete data set in
// accordance with the open left boundary (OLB) convention.
Series ftableBOL = StatisticalEngine.CFrequencyTableBOL("CFrequencyBOL",sampledata1,
new double[] {1,5,10,15});
CorrelationChart.SeriesCollection.Add(ftableBOL);
CorrelationChart.SeriesCollection.Add (scorrelation);
}
</script>
</head>
<body>
<div style="text-align:center">
<dotnet:Chart id="CorrelationChart" runat="server"/>
</div>
</body>
</html>
<%@ Page Language="vb" Description="dotnetCHARTING Component" %>
<%@ Register TagPrefix="dotnet" Namespace="dotnetCHARTING" Assembly="dotnetCHARTING"%>
<%@ Import Namespace="System.Drawing" %>
<%@ Import Namespace="System.Drawing.Drawing2D" %>
<html xmlns="http://www.w3.org/1999/xhtml">
<head>
<title>.netCHARTING Sample</title>
<script runat="server">
Sub Page_Load(ByVal sender As Object, ByVal e As EventArgs)
' Demonstrates the use of statistical procedures for summarize quantitative data from
' within DataPresentation class from within WebCab.Statistics module.
' The Correlation Chart
CorrelationChart.Title="Frequency"
CorrelationChart.TempDirectory = "temp"
CorrelationChart.Debug=True
CorrelationChart.Size = "600x400"
CorrelationChart.LegendBox.Template ="%icon %name"
CorrelationChart.XAxis.Scale = Scale.Normal
CorrelationChart.TitleBox.Position = TitleBoxPosition.FullWithLegend
CorrelationChart.DefaultSeries.Type = SeriesType.Cylinder
Dim myR As Random = New Random(1)
Dim scorrelation As SeriesCollection = New SeriesCollection()
Dim sampledata1 As Series = New Series ("Sample 1")
For a As Integer = 1 To 15
Dim el As Element = New Element()
el.YValue = myR.Next(10)
el.XValue = a
sampledata1.Elements.Add (el)
Next a
scorrelation.Add (sampledata1)
scorrelation(0).Type = SeriesType.Spline
scorrelation(0).DefaultElement.Color = Color.FromArgb(255,99,49)
' CFrequencyTableAOL - Calculates the cumulative frequency table from above for a discrete data set
' in accordance with the open left boundary (OLB) convention.
Dim ftableAOL As Series = StatisticalEngine.CFrequencyTableAOL("CFrequencyAOL",sampledata1, New Double() {1,5,10,15})
CorrelationChart.SeriesCollection.Add(ftableAOL)
' CFrequencyTableBOL - Calculates the cumulative frequency table from below for a discrete data set in
' accordance with the open left boundary (OLB) convention.
Dim ftableBOL As Series = StatisticalEngine.CFrequencyTableBOL("CFrequencyBOL",sampledata1, New Double() {1,5,10,15})
CorrelationChart.SeriesCollection.Add(ftableBOL)
CorrelationChart.SeriesCollection.Add (scorrelation)
End Sub
</script>
</head>
<body>
<div style="text-align:center">
<dotnet:Chart id="CorrelationChart" runat="server"/>
</div>
</body>
</html>
- Sample FilenameFrequencyTable.aspx
- VersionLegacy (Pre 3.0)
- Uses DatabaseNo