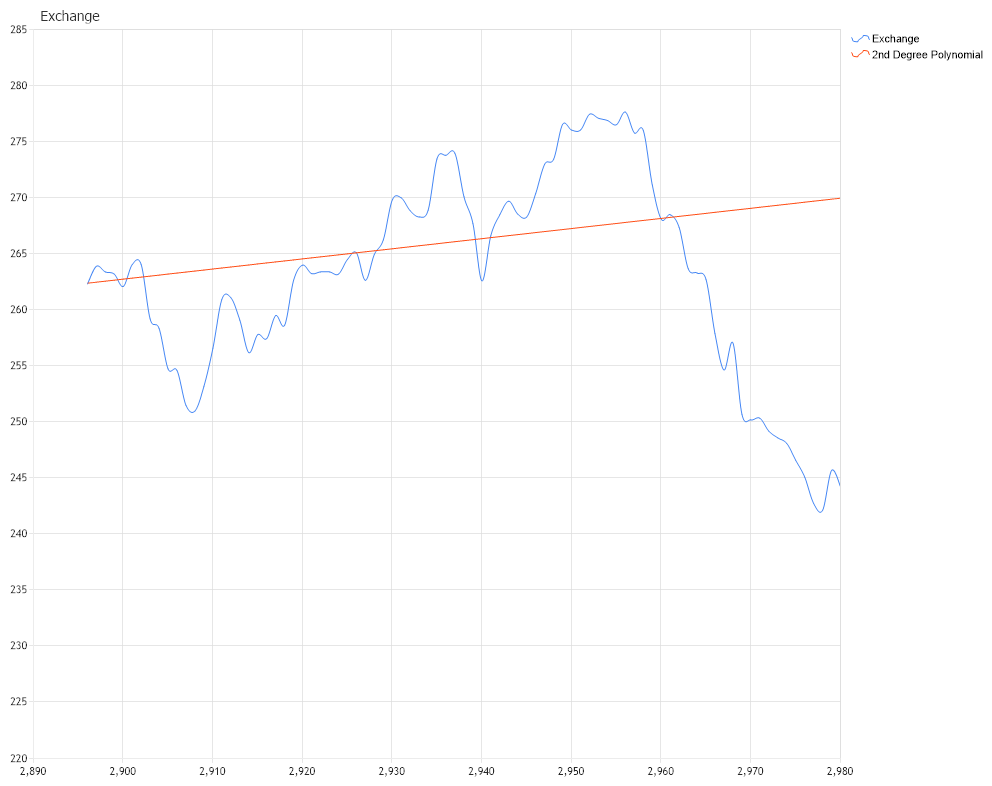
Non Linear Polynomial
Demonstrates the use of NonLinear Forecasting model in order to find the function of best fit.
<%@ Page Language="C#" Description="dotnetCHARTING Component" %>
<%@ Register TagPrefix="dotnet" Namespace="dotnetCHARTING" Assembly="dotnetCHARTING"%>
<%@ Import Namespace="System.Drawing" %>
<%@ Import Namespace="System.Drawing.Drawing2D" %>
<%@ Import Namespace="dotnetCHARTING"%>
<script runat="server">
void Page_Load(Object sender,EventArgs e)
{
// Demonstrates the use of NonLinear Forecasting model in order to
// find the function of best fit. The data used for which the fuctions are fit is a set
// of data which represents a FX exchange rate over a given period of time.
// The Forecast Chart
ForecastChart.Title="Exchange";
ForecastChart.TempDirectory="temp";
ForecastChart.Debug=true;
ForecastChart.Size = "1000x800";
ForecastChart.LegendBox.Template ="%icon %name";
ForecastChart.YAxis.ScaleRange.ValueLow = 220;
ForecastChart.Type = ChartType.Scatter;
ForecastChart.XAxis.Minimum = 2890;
ForecastChart.XAxis.Maximum = 2980;
ForecastChart.XAxis.Interval = 10;
// The Forecast data
DataEngine de = new DataEngine ();
de.ConnectionString = ConfigurationManager.AppSettings["DNCConnectionString"];
de.DateGrouping = TimeInterval.Days;
de.StartDate = new DateTime(1982,8,7,0,0,0);
de.EndDate = new DateTime(1982,12,10,0,0,0);
de.SqlStatement= @"SELECT ID, Value AS q FROM Exchange WHERE Data >= #STARTDATE# AND Data <= #ENDDATE# ORDER BY Data ";
//Add a series
SeriesCollection scForecast = de.GetSeries ();
ForecastChart.SeriesCollection.Add (scForecast);
scForecast[0].Name = "Exchange";
scForecast[0].Type = SeriesType.Spline;
/*
* Takes off the marker off the line and spline series.
*/
ForecastChart.DefaultSeries.DefaultElement.Marker = new ElementMarker (ElementMarkerType.None);
ForecastChart.ChartAreaLayout.Mode = ChartAreaLayoutMode.Vertical;
// Generate a series of standard deviation for the given points
Series deviation = new Series();
for (int i = 0; i < scForecast[0].Elements.Count; i++ )
{
Element el = new Element();
el.XValue = scForecast[0].Elements[i].XValue;
el.YValue = 0.0000001;
deviation.Elements.Add(el);
}
// Note that this line is necessary in order to clear the function basis set by previous
// example.
//
ForecastEngine.Options.Reset();
// Set the first model function
//
ForecastEngine.Options.AddSumOfNonLinearPowerTerms(new double[]{1}, new double[]{1}, new double[] {0}, new double[] {1});
ForecastEngine.Options.AddSumOfNonLinearPowerTerms(new double[]{1}, new double[]{1}, new double[] {0}, new double[] {2});
// Generate a new series which will draw the best fitline according with the model function which we just set
Series nonLinearModel1 = new Series();
nonLinearModel1 = ForecastEngine.Advanced.NonLinearModel(scForecast[0], deviation,
new double[] {0.09, 1.0, 1.0, 1.0, 0.0001, 1.0, 1.0, 1.0},
new bool[] {true, true, true, true, true, true, true, true});
nonLinearModel1.Name = "2nd Degree Polynomial";
nonLinearModel1.Type = SeriesType.Spline;
ForecastChart.SeriesCollection.Add(nonLinearModel1);
}
</script>
<html>
<head>
<title>.netCHARTING Forecasting Sample</title>
</head>
<body>
<div align="center">
<dotnet:Chart id="ForecastChart" runat="server"/>
</dotnet:Chart>
</div>
</body>
</html>
<%@ Page Language="vb" Description="dotnetCHARTING Component" %>
<%@ Register TagPrefix="dotnet" Namespace="dotnetCHARTING" Assembly="dotnetCHARTING"%>
<%@ Import Namespace="System.Drawing" %>
<%@ Import Namespace="System.Drawing.Drawing2D" %>
<%@ Import Namespace="dotnetCHARTING"%>
<script runat="server">
Sub Page_Load(ByVal sender As Object, ByVal e As EventArgs)
' Demonstrates the use of NonLinear Forecasting model in order to
' find the function of best fit. The data used for which the fuctions are fit is a set
' of data which represents a FX exchange rate over a given period of time.
' The Forecast Chart
ForecastChart.Title="Exchange"
ForecastChart.TempDirectory="temp"
ForecastChart.Debug=True
ForecastChart.Size = "1000x800"
ForecastChart.LegendBox.Template ="%icon %name"
ForecastChart.YAxis.ScaleRange.ValueLow = 220
ForecastChart.Type = ChartType.Scatter
ForecastChart.XAxis.Minimum = 2890
ForecastChart.XAxis.Maximum = 2980
ForecastChart.XAxis.Interval = 10
' The Forecast data
Dim de As DataEngine = New DataEngine ()
de.ConnectionString = ConfigurationManager.AppSettings("DNCConnectionString")
de.DateGrouping = TimeInterval.Days
de.StartDate = New DateTime(1982,8,7,0,0,0)
de.EndDate = New DateTime(1982,12,10,0,0,0)
de.SqlStatement= "SELECT ID, Value AS q FROM Exchange WHERE Data >= #STARTDATE# AND Data <= #ENDDATE# ORDER BY Data "
'Add a series
Dim scForecast As SeriesCollection = de.GetSeries ()
ForecastChart.SeriesCollection.Add (scForecast)
scForecast(0).Name = "Exchange"
scForecast(0).Type = SeriesType.Spline
'
'* Takes off the marker off the line and spline series.
'
ForecastChart.DefaultSeries.DefaultElement.Marker = New ElementMarker (ElementMarkerType.None)
ForecastChart.ChartAreaLayout.Mode = ChartAreaLayoutMode.Vertical
' Generate a series of standard deviation for the given points
Dim deviation As Series = New Series()
For i As Integer = 0 To scForecast(0).Elements.Count - 1
Dim el As Element = New Element()
el.XValue = scForecast(0).Elements(i).XValue
el.YValue = 0.0000001
deviation.Elements.Add(el)
Next i
' Note that this line is necessary in order to clear the function basis set by previous
' example.
'
ForecastEngine.Options.Reset()
' Set the first model function
'
ForecastEngine.Options.AddSumOfNonLinearPowerTerms(New Double(){1}, New Double(){1}, New Double() {0}, New Double() {1})
ForecastEngine.Options.AddSumOfNonLinearPowerTerms(New Double(){1}, New Double(){1}, New Double() {0}, New Double() {2})
' Generate a new series which will draw the best fitline according with the model function which we just set
Dim nonLinearModel1 As Series = New Series()
nonLinearModel1 = ForecastEngine.Advanced.NonLinearModel(scForecast(0), deviation, New Double() {0.09, 1.0, 1.0, 1.0, 0.0001, 1.0, 1.0, 1.0}, New Boolean() {True, True, True, True, True, True, True, True})
nonLinearModel1.Name = "2nd Degree Polynomial"
nonLinearModel1.Type = SeriesType.Spline
ForecastChart.SeriesCollection.Add(nonLinearModel1)
End Sub
</script>
<html>
<head>
<title>.netCHARTING Forecasting Sample</title>
</head>
<body>
<div align="center">
<dotnet:Chart id="ForecastChart" runat="server"/>
</dotnet:Chart>
</div>
</body>
</html>