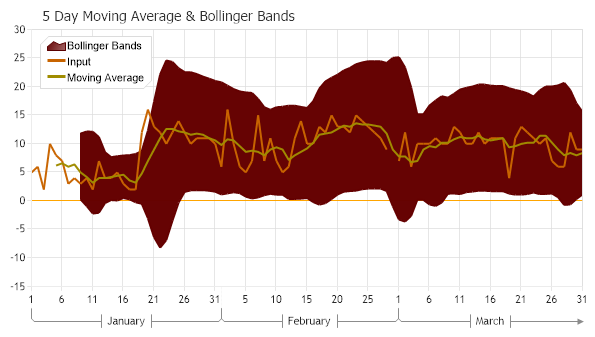
Bollinger Bands
Demonstrates creating a 5 Day Moving Average and Bollinger Bands chart using live data.
<%@ Page Language="C#" Description="dotnetCHARTING Component" %>
<%@ Register TagPrefix="dnc" Namespace="dotnetCHARTING" Assembly="dotnetCHARTING" %>
<%@ Import Namespace="System.Drawing" %>
<script runat="server">
void Page_Load(Object sender, EventArgs e)
{
// Demonstrates creating a 5 Day Moving Average & Bollinger Bands chart using live data.
Chart.Size = "600x350";
Chart.Title = "5 Day Moving Average & Bollinger Bands";
Chart.TempDirectory = "temp";
Chart.Debug = true;
Chart.ShowDateInTitle = false;
// Setup Chart & Styling.
Chart.PaletteName = Palette.DarkRainbow;
Chart.YAxis.ZeroTick.GridLine.Color = Color.Orange;
Chart.DefaultElement.Marker.Visible = false;
Chart.LegendBox.Position = new Point(40, 50);
Chart.DefaultSeries.Type = SeriesType.Line;
Chart.DefaultSeries.Line.Width = 2;
Chart.YAxis.Scale = Scale.Range;
Chart.XAxis.Scale = Scale.Time;
Chart.XAxis.TimeScaleLabels.RangeIntervals.Add(TimeInterval.Month);
Chart.XAxis.FormatString = "d ";
Chart.LegendBox.Template = "%Icon%Name";
Chart.LegendBox.Background.Color = Color.White;
// Get the live data.
SeriesCollection mySC = getLiveData();
mySC[0].Name = "Input";
// SimpleMovingAverage requires the elements are sorted in descending order
mySC.Sort(ElementValue.XDateTime, "Desc");
//Get Moving Average
SeriesCollection ma = FinancialEngine.SimpleMovingAverage(mySC, ElementValue.YValue, 5);
ma[0].Name = "Moving Average";
// Get Bollinger Bands as two series.
SeriesCollection bands = StatisticalEngine.BollingerBands(ma[0],5, 5);
// Take one of the bollinger band series and use the values of the second series to set element.YValueStart of the first series.
// Only the first series will be added to the chart.
Series BBans = bands[0];
BBans.Type = SeriesType.AreaLine;
BBans.Name = "Bollinger Bands";
for (int i = 0; i < bands[0].Elements.Count; i++)
{
BBans[i].YValueStart = bands[1][i].YValue;
}
// Add the series.
Chart.SeriesCollection.Add(BBans);
Chart.SeriesCollection.Add(mySC);
Chart.SeriesCollection.Add(ma);
}
SeriesCollection getLiveData()
{
DataEngine de = new DataEngine(ConfigurationManager.AppSettings["DNCConnectionString"]);
de.ChartObject = Chart; // Necessary to view any errors the dataEngine may throw.
de.DateGrouping = TimeInterval.Days;
de.StartDate = new DateTime(2020, 1, 1, 0, 0, 0);
de.EndDate = new DateTime(2020, 3, 31, 23, 59, 59);
de.SqlStatement = @"SELECT TrafficDate, Clicks AS q FROM TrafficReport WHERE TrafficDate >= #STARTDATE# AND TrafficDate <= #ENDDATE# ORDER BY TrafficDate ";
return de.GetSeries();
}
</script>
<html xmlns="http://www.w3.org/1999/xhtml">
<head>
<title>.netCHARTING Sample</title>
</head>
<body>
<div align="center">
<dnc:Chart ID="Chart" runat="server" />
</div>
</body>
</html>
<%@ Page Language="vb" Description="dotnetCHARTING Component" %>
<%@ Register TagPrefix="dnc" Namespace="dotnetCHARTING" Assembly="dotnetCHARTING" %>
<%@ Import Namespace="System.Drawing" %>
<script runat="server">
Sub Page_Load(ByVal sender As Object, ByVal e As EventArgs)
' Demonstrates creating a 5 Day Moving Average & Bollinger Bands chart using live data.
Chart.Size = "600x350"
Chart.Title = "5 Day Moving Average & Bollinger Bands"
Chart.TempDirectory = "temp"
Chart.Debug = True
Chart.ShowDateInTitle = False
' Setup Chart & Styling.
Chart.PaletteName = Palette.DarkRainbow
Chart.YAxis.ZeroTick.GridLine.Color = Color.Orange
Chart.DefaultElement.Marker.Visible = False
Chart.LegendBox.Position = New Point(40, 50)
Chart.DefaultSeries.Type = SeriesType.Line
Chart.DefaultSeries.Line.Width = 2
Chart.YAxis.Scale = Scale.Range
Chart.XAxis.Scale = Scale.Time
Chart.XAxis.TimeScaleLabels.RangeIntervals.Add(TimeInterval.Month)
Chart.XAxis.FormatString = "d "
Chart.LegendBox.Template = "%Icon%Name"
Chart.LegendBox.Background.Color = Color.White
' Get the live data.
Dim mySC As SeriesCollection = getLiveData()
mySC(0).Name = "Input"
' SimpleMovingAverage requires the elements are sorted in descending order
mySC.Sort(ElementValue.XDateTime, "Desc")
'Get Moving Average
Dim ma As SeriesCollection = FinancialEngine.SimpleMovingAverage(mySC, ElementValue.YValue, 5)
ma(0).Name = "Moving Average"
' Get Bollinger Bands as two series.
Dim bands As SeriesCollection = StatisticalEngine.BollingerBands(ma(0),5, 5)
' Take one of the bollinger band series and use the values of the second series to set element.YValueStart of the first series.
' Only the first series will be added to the chart.
Dim BBans As Series = bands(0)
BBans.Type = SeriesType.AreaLine
BBans.Name = "Bollinger Bands"
For i As Integer = 0 To bands(0).Elements.Count - 1
BBans(i).YValueStart = bands(1)(i).YValue
Next i
' Add the series.
Chart.SeriesCollection.Add(BBans)
Chart.SeriesCollection.Add(mySC)
Chart.SeriesCollection.Add(ma)
End Sub
Function getLiveData() As SeriesCollection
Dim de As DataEngine = New DataEngine(ConfigurationManager.AppSettings("DNCConnectionString"))
de.ChartObject = Chart ' Necessary to view any errors the dataEngine may throw.
de.DateGrouping = TimeInterval.Days
de.StartDate = New DateTime(2020, 1, 1, 0, 0, 0)
de.EndDate = New DateTime(2020, 3, 31, 23, 59, 59)
de.SqlStatement = "SELECT TrafficDate, Clicks AS q FROM TrafficReport WHERE TrafficDate >= #STARTDATE# AND TrafficDate <= #ENDDATE# ORDER BY TrafficDate "
Return de.GetSeries()
End Function
</script>
<html xmlns="http://www.w3.org/1999/xhtml">
<head>
<title>.netCHARTING Sample</title>
</head>
<body>
<div align="center">
<dnc:Chart ID="Chart" runat="server" />
</div>
</body>
</html>