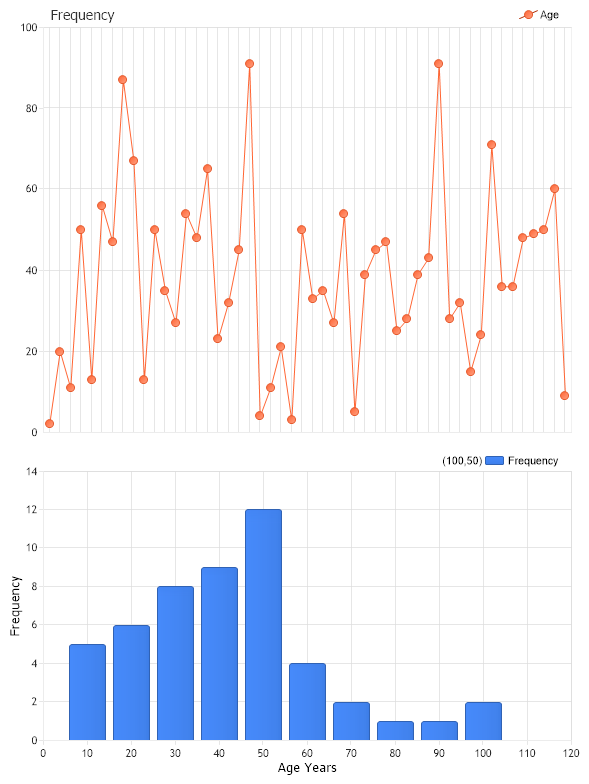
Histogram
Demonstrates the use of statistical procedures for summarize quantitative data from within StatisticalEngine.
<%@ Page Language="C#" Description="dotnetCHARTING Component" %>
<%@ Register TagPrefix="dotnet" Namespace="dotnetCHARTING" Assembly="dotnetCHARTING"%>
<%@ Import Namespace="System.Drawing" %>
<%@ Import Namespace="System.Drawing.Drawing2D" %>
<%@ Import Namespace="dotnetCHARTING"%>
<html xmlns="http://www.w3.org/1999/xhtml">
<head>
<title>.netCHARTING Sample</title>
<script runat="server">
void Page_Load(Object sender,EventArgs e)
{
// Demonstrates the use of statistical procedures for summarize quantitative data from within StatisticalEngine.
// In this sample we show the age distributions of a doctor's pacients.
// The age is given in years.
// The Histogram Chart
HistogramChart.Title="Frequency";
HistogramChart.TempDirectory = "temp";
HistogramChart.Debug=true;
HistogramChart.Size = "600x800";
HistogramChart.LegendBox.Template ="%icon %name";
HistogramChart.TitleBox.Position = TitleBoxPosition.FullWithLegend;
HistogramChart.XAxis.Interval=1;
HistogramChart.ChartArea.Line= new Line(Color.FromArgb(100, 220, 220, 220),1);
HistogramChart.DefaultTitleBox.Position = TitleBoxPosition.FullWithLegend;
int[] pacientsAge = new int[] {2,20,11,50,13,56,47,87,67,13,50,35,27,54,48,65,23,32,45,91,4,11,21,3,50,33,
35,27,54,5,39,45,47,25,28,39,43,91,28,32,15,24,71,36,36,48,49,50,60,9};
Series sampledata = new Series ("Age");
for ( int i=0; i < pacientsAge.Length; i++) {
Element el = new Element();
el.YValue = pacientsAge[i];
sampledata.Elements.Add (el);
}
// Add the series sampledata to the collection of series
sampledata.Type = SeriesType.Line;
sampledata.DefaultElement.Color = Color.FromArgb(255,99,49);
HistogramChart.SeriesCollection.Add(sampledata);
HistogramChart.ChartAreaLayout.Mode = ChartAreaLayoutMode.Vertical;
// Accumulate distribute chart area
ChartArea histChartArea = new ChartArea ();
histChartArea.HeightPercentage = 40;
histChartArea.YAxis.Label.Text = "Frequency";
histChartArea.XAxis.Label.Text = "Age Years";
histChartArea.XAxis.Interval=10;
HistogramChart.ExtraChartAreas.Add (histChartArea);
// CFrequencyTableAOL - Calculates the cumulative frequency table from above for a discrete data set
// in accordance with the open left boundary (OLB) convention.
Series ftableOL = StatisticalEngine.FrequencyTableOL("Frequency", sampledata, new double[] {10,20,30,40,50,60,70,80,90,100});
histChartArea.SeriesCollection.Add(ftableOL);
}
</script>
</head>
<body>
<div style="text-align:center">
<dotnet:Chart id="HistogramChart" runat="server"/>
</div>
</body>
</html>
<%@ Page Language="vb" Description="dotnetCHARTING Component" %>
<%@ Register TagPrefix="dotnet" Namespace="dotnetCHARTING" Assembly="dotnetCHARTING"%>
<%@ Import Namespace="System.Drawing" %>
<%@ Import Namespace="System.Drawing.Drawing2D" %>
<%@ Import Namespace="dotnetCHARTING"%>
<html xmlns="http://www.w3.org/1999/xhtml">
<head>
<title>.netCHARTING Sample</title>
<script runat="server">
Sub Page_Load(ByVal sender As Object, ByVal e As EventArgs)
' Demonstrates the use of statistical procedures for summarize quantitative data from within StatisticalEngine.
' In this sample we show the age distributions of a doctor's pacients.
' The age is given in years.
' The Histogram Chart
HistogramChart.Title="Frequency"
HistogramChart.TempDirectory = "temp"
HistogramChart.Debug=True
HistogramChart.Size = "600x800"
HistogramChart.LegendBox.Template ="%icon %name"
HistogramChart.TitleBox.Position = TitleBoxPosition.FullWithLegend
HistogramChart.XAxis.Interval=1
HistogramChart.ChartArea.Line= New Line(Color.FromArgb(100, 220, 220, 220),1)
HistogramChart.DefaultTitleBox.Position = TitleBoxPosition.FullWithLegend
Dim pacientsAge As Integer() = New Integer() {2,20,11,50,13,56,47,87,67,13,50,35,27,54,48,65,23,32,45,91,4,11,21,3,50,33, 35,27,54,5,39,45,47,25,28,39,43,91,28,32,15,24,71,36,36,48,49,50,60,9}
Dim sampledata As Series = New Series ("Age")
For i As Integer = 0 To pacientsAge.Length - 1
Dim el As Element = New Element()
el.YValue = pacientsAge(i)
sampledata.Elements.Add (el)
Next i
' Add the series sampledata to the collection of series
sampledata.Type = SeriesType.Line
sampledata.DefaultElement.Color = Color.FromArgb(255,99,49)
HistogramChart.SeriesCollection.Add(sampledata)
HistogramChart.ChartAreaLayout.Mode = ChartAreaLayoutMode.Vertical
' Accumulate distribute chart area
Dim histChartArea As ChartArea = New ChartArea ()
histChartArea.HeightPercentage = 40
histChartArea.YAxis.Label.Text = "Frequency"
histChartArea.XAxis.Label.Text = "Age Years"
histChartArea.XAxis.Interval=10
HistogramChart.ExtraChartAreas.Add (histChartArea)
' CFrequencyTableAOL - Calculates the cumulative frequency table from above for a discrete data set
' in accordance with the open left boundary (OLB) convention.
Dim ftableOL As Series = StatisticalEngine.FrequencyTableOL("Frequency", sampledata, New Double() {10,20,30,40,50,60,70,80,90,100})
histChartArea.SeriesCollection.Add(ftableOL)
End Sub
</script>
</head>
<body>
<div style="text-align:center">
<dotnet:Chart id="HistogramChart" runat="server"/>
</div>
</body>
</html>