Gallery
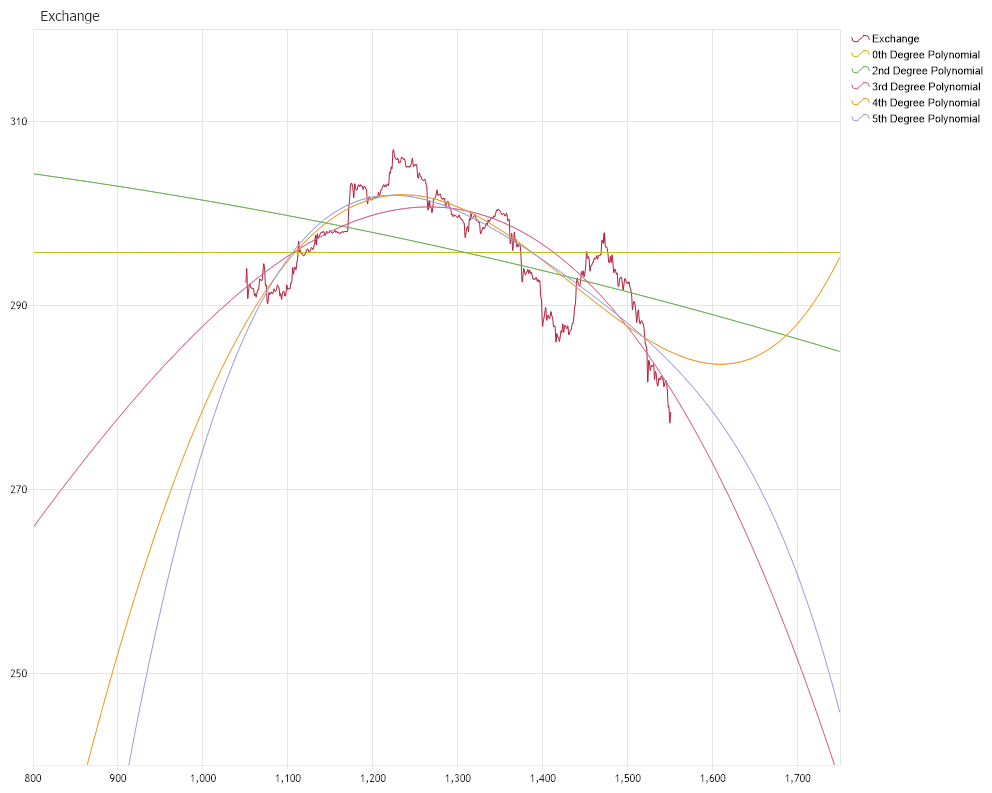
Polynomial Fitting Extended
<%@ Page Language="C#" Description="dotnetCHARTING Component" %>
<%@ Register TagPrefix="dotnet" Namespace="dotnetCHARTING" Assembly="dotnetCHARTING"%>
<%@ Import Namespace="System.Drawing" %>
<%@ Import Namespace="System.Drawing.Drawing2D" %>
<%@ Import Namespace="dotnetCHARTING"%>
<html xmlns="http://www.w3.org/1999/xhtml">
<head>
<title>.netCHARTING Forecasting Sample</title>
<script runat="server">
void Page_Load(Object sender,EventArgs e)
{
// Demonstrates the use of GeneralLinear Forecasting engine in order to
// find the function of best fit from three functions spaces. The data used for which
// the fuctions are fit is a set of data which represents a FX exchange rate over a given
// period of time. We index the period by the number of days after the inital date and the
// eights function spaces are the spaces spanned by the following basis elements:
//
// 1) {(1)}
// 2) {(1), (x)}
// 3) {(1), (x), (x^2)}
// 4) {(1), (x), (x^2), (x^3)}
// 5) {(1), (x), (x^2), (x^3), (x^4)}
// 6) {(1), (x), (x^2), (x^3), (x^4), (x^5)}
// 7) {(1), (x), (x^2), (x^3), (x^4), (x^5), (x^6)}
// 8) {(1), (x), (x^2), (x^3), (x^4), (x^5), (x^6), (x^7)}
//
// The Forecast Chart
ForecastChart.Title="Exchange";
ForecastChart.TempDirectory="temp";
ForecastChart.Debug=true;
ForecastChart.Size = "1000x800";
ForecastChart.LegendBox.Template ="%icon %name";
ForecastChart.PaletteName = Palette.Three;
ForecastChart.Type = ChartType.Scatter;
// The following line allows the source data from which the curve of best fits are
// calibrated to be plotted with curve of best fit and for the x-axis values to be
// syncronized.
//
ForecastChart.XAxis.Scale = Scale.Normal;
//
//In the next four line we set the range of the axis
//
ForecastChart.XAxis.ScaleRange.ValueLow = 800;
ForecastChart.XAxis.ScaleRange.ValueHigh = 1750;
ForecastChart.YAxis.ScaleRange.ValueLow = 310;
ForecastChart.YAxis.ScaleRange.ValueLow = 240;
// The Forecast data
DataEngine de = new DataEngine ();
de.ConnectionString = ConfigurationManager.AppSettings["DNCConnectionString"];
de.SqlStatement = @"SELECT ID, Value FROM Exchange WHERE ID Between 1050 AND 1550";
de.DataFields = "xAxis=ID,yAxis=Value";
//Add a series
SeriesCollection scForecast = de.GetSeries ();
ForecastChart.SeriesCollection.Add (scForecast);
scForecast[0].Name = "Exchange";
scForecast[0].Type = SeriesType.Spline;
/*
* Takes off the marker off the line and spline series.
*/
ForecastChart.DefaultSeries.DefaultElement.Marker = new ElementMarker (ElementMarkerType.None);
ForecastChart.ChartAreaLayout.Mode = ChartAreaLayoutMode.Vertical;
// Generate a series of standard deviation for the given points
Series deviation = new Series();
for (int i = 0; i < scForecast[0].Elements.Count; i++ )
{
Element el = new Element();
el.XValue = scForecast[0].Elements[i].XValue;
el.YValue = 0.0000000001;
deviation.Elements.Add(el);
}
// Declare a new serie for the ChiSquare elements
Series chiSquareSeries = new Series();
// Note that this line is necessary in order to clear the function basis set by previous
// example.
//
ForecastEngine.Options.Reset();
// Set the first model function
//
// The second basis element: (1)
ForecastEngine.Options.AddSumOfPowerTerms(new double[]{1}, new double[]{0});
Series generalLinear = new Series();
// In the next line we call the method which will find the best fitting curve
generalLinear = ForecastEngine.Advanced.GeneralLinear(scForecast[0], deviation, 800,1750,1);
generalLinear.Name = "0th Degree Polynomial";
generalLinear.Type = SeriesType.Spline;
ForecastChart.SeriesCollection.Add(generalLinear);
// Set the third model function ; we add x^2 function to the basis functions
ForecastEngine.Options.AddSumOfPowerTerms(new double[]{1}, new double[]{2});
// Generate a new series which will draw the best fit line according with the model function which we just set
Series generalLinearModel3 = new Series();
// In the next line we call the method which will find the best fitting curve. The third and
// the forth parameter of this method represent the lower and upper limit on the XAxis
// between which the curve is represented
generalLinearModel3 = ForecastEngine.Advanced.GeneralLinear(scForecast[0], deviation,800,1750,1);
generalLinearModel3.Name = "2nd Degree Polynomial";
generalLinearModel3.Type = SeriesType.Spline;
ForecastChart.SeriesCollection.Add(generalLinearModel3);
// We add x^3 function to the basis functions
ForecastEngine.Options.AddSumOfPowerTerms(new double[]{1}, new double[]{3});
// Generate a new series which will draw the best fit line according with the model function which we just set
Series generalLinearModel4 = new Series();
generalLinearModel4 = ForecastEngine.Advanced.GeneralLinear(scForecast[0], deviation,800,1750,1);
generalLinearModel4.Name = "3rd Degree Polynomial";
generalLinearModel4.Type = SeriesType.Spline;
ForecastChart.SeriesCollection.Add(generalLinearModel4);
// We add x^4 function to the basis functions
ForecastEngine.Options.AddSumOfPowerTerms(new double[]{1}, new double[]{4});
// Generate a new series which will draw the best fit line according with the model function which we just set
Series generalLinearModel5 = new Series();
generalLinearModel5 = ForecastEngine.Advanced.GeneralLinear(scForecast[0], deviation, 800, 1750, 1);
generalLinearModel5.Name = "4th Degree Polynomial";
generalLinearModel5.Type = SeriesType.Spline;
ForecastChart.SeriesCollection.Add(generalLinearModel5);
// We add x^5 function to the basis functions
ForecastEngine.Options.AddSumOfPowerTerms(new double[]{1}, new double[]{5});
// Generate a new series which will draw the best fit line according with the model function which we just set
Series generalLinearModel6 = new Series();
generalLinearModel6 = ForecastEngine.Advanced.GeneralLinear(scForecast[0], deviation, 800, 1750, 1);
generalLinearModel6.Name = "5th Degree Polynomial";
generalLinearModel6.Type = SeriesType.Spline;
ForecastChart.SeriesCollection.Add(generalLinearModel6);
}
</script>
</head>
<body>
<div style="text-align:center">
<dotnet:Chart id="ForecastChart" runat="server"/>
</div>
</body>
</html>
<%@ Page Language="vb" Description="dotnetCHARTING Component" %>
<%@ Register TagPrefix="dotnet" Namespace="dotnetCHARTING" Assembly="dotnetCHARTING"%>
<%@ Import Namespace="System.Drawing" %>
<%@ Import Namespace="System.Drawing.Drawing2D" %>
<%@ Import Namespace="dotnetCHARTING"%>
<html xmlns="http://www.w3.org/1999/xhtml">
<head>
<title>.netCHARTING Forecasting Sample</title>
<script runat="server">
Sub Page_Load(ByVal sender As Object, ByVal e As EventArgs)
' Demonstrates the use of GeneralLinear Forecasting engine in order to
' find the function of best fit from three functions spaces. The data used for which
' the fuctions are fit is a set of data which represents a FX exchange rate over a given
' period of time. We index the period by the number of days after the inital date and the
' eights function spaces are the spaces spanned by the following basis elements:
'
' 1) {(1)}
' 2) {(1), (x)}
' 3) {(1), (x), (x^2)}
' 4) {(1), (x), (x^2), (x^3)}
' 5) {(1), (x), (x^2), (x^3), (x^4)}
' 6) {(1), (x), (x^2), (x^3), (x^4), (x^5)}
' 7) {(1), (x), (x^2), (x^3), (x^4), (x^5), (x^6)}
' 8) {(1), (x), (x^2), (x^3), (x^4), (x^5), (x^6), (x^7)}
'
' The Forecast Chart
ForecastChart.Title="Exchange"
ForecastChart.TempDirectory="temp"
ForecastChart.Debug=True
ForecastChart.Size = "1000x800"
ForecastChart.LegendBox.Template ="%icon %name"
ForecastChart.PaletteName = Palette.Three
ForecastChart.Type = ChartType.Scatter
' The following line allows the source data from which the curve of best fits are
' calibrated to be plotted with curve of best fit and for the x-axis values to be
' syncronized.
'
ForecastChart.XAxis.Scale = Scale.Normal
'
'In the next four line we set the range of the axis
'
ForecastChart.XAxis.ScaleRange.ValueLow = 800
ForecastChart.XAxis.ScaleRange.ValueHigh = 1750
ForecastChart.YAxis.ScaleRange.ValueLow = 310
ForecastChart.YAxis.ScaleRange.ValueLow = 240
' The Forecast data
Dim de As DataEngine = New DataEngine ()
de.ConnectionString = ConfigurationManager.AppSettings("DNCConnectionString")
de.SqlStatement = "SELECT ID, Value FROM Exchange WHERE ID Between 1050 AND 1550"
de.DataFields = "xAxis=ID,yAxis=Value"
'Add a series
Dim scForecast As SeriesCollection = de.GetSeries ()
ForecastChart.SeriesCollection.Add (scForecast)
scForecast(0).Name = "Exchange"
scForecast(0).Type = SeriesType.Spline
'
'* Takes off the marker off the line and spline series.
'
ForecastChart.DefaultSeries.DefaultElement.Marker = New ElementMarker (ElementMarkerType.None)
ForecastChart.ChartAreaLayout.Mode = ChartAreaLayoutMode.Vertical
' Generate a series of standard deviation for the given points
Dim deviation As Series = New Series()
For i As Integer = 0 To scForecast(0).Elements.Count - 1
Dim el As Element = New Element()
el.XValue = scForecast(0).Elements(i).XValue
el.YValue = 0.0000000001
deviation.Elements.Add(el)
Next i
' Declare a new serie for the ChiSquare elements
Dim chiSquareSeries As Series = New Series()
' Note that this line is necessary in order to clear the function basis set by previous
' example.
'
ForecastEngine.Options.Reset()
' Set the first model function
'
' The second basis element: (1)
ForecastEngine.Options.AddSumOfPowerTerms(New Double(){1}, New Double(){0})
Dim generalLinear As Series = New Series()
' In the next line we call the method which will find the best fitting curve
generalLinear = ForecastEngine.Advanced.GeneralLinear(scForecast(0), deviation, 800,1750,1)
generalLinear.Name = "0th Degree Polynomial"
generalLinear.Type = SeriesType.Spline
ForecastChart.SeriesCollection.Add(generalLinear)
' Set the third model function ; we add x^2 function to the basis functions
ForecastEngine.Options.AddSumOfPowerTerms(New Double(){1}, New Double(){2})
' Generate a new series which will draw the best fit line according with the model function which we just set
Dim generalLinearModel3 As Series = New Series()
' In the next line we call the method which will find the best fitting curve. The third and
' the forth parameter of this method represent the lower and upper limit on the XAxis
' between which the curve is represented
generalLinearModel3 = ForecastEngine.Advanced.GeneralLinear(scForecast(0), deviation,800,1750,1)
generalLinearModel3.Name = "2nd Degree Polynomial"
generalLinearModel3.Type = SeriesType.Spline
ForecastChart.SeriesCollection.Add(generalLinearModel3)
' We add x^3 function to the basis functions
ForecastEngine.Options.AddSumOfPowerTerms(New Double(){1}, New Double(){3})
' Generate a new series which will draw the best fit line according with the model function which we just set
Dim generalLinearModel4 As Series = New Series()
generalLinearModel4 = ForecastEngine.Advanced.GeneralLinear(scForecast(0), deviation,800,1750,1)
generalLinearModel4.Name = "3rd Degree Polynomial"
generalLinearModel4.Type = SeriesType.Spline
ForecastChart.SeriesCollection.Add(generalLinearModel4)
' We add x^4 function to the basis functions
ForecastEngine.Options.AddSumOfPowerTerms(New Double(){1}, New Double(){4})
' Generate a new series which will draw the best fit line according with the model function which we just set
Dim generalLinearModel5 As Series = New Series()
generalLinearModel5 = ForecastEngine.Advanced.GeneralLinear(scForecast(0), deviation, 800, 1750, 1)
generalLinearModel5.Name = "4th Degree Polynomial"
generalLinearModel5.Type = SeriesType.Spline
ForecastChart.SeriesCollection.Add(generalLinearModel5)
' We add x^5 function to the basis functions
ForecastEngine.Options.AddSumOfPowerTerms(New Double(){1}, New Double(){5})
' Generate a new series which will draw the best fit line according with the model function which we just set
Dim generalLinearModel6 As Series = New Series()
generalLinearModel6 = ForecastEngine.Advanced.GeneralLinear(scForecast(0), deviation, 800, 1750, 1)
generalLinearModel6.Name = "5th Degree Polynomial"
generalLinearModel6.Type = SeriesType.Spline
ForecastChart.SeriesCollection.Add(generalLinearModel6)
End Sub
</script>
</head>
<body>
<div style="text-align:center">
<dotnet:Chart id="ForecastChart" runat="server"/>
</div>
</body>
</html>
- Sample FilenamePolynomialFittingExtended.aspx
- VersionLegacy (Pre 3.0)
- Uses DatabaseYes