Gallery
Normal Distribution
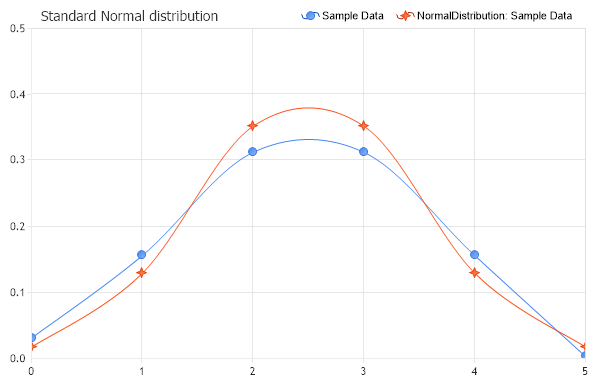
Demonstrates the use of NormalDistribution method from the StatisticalEngine. This method return the normal distribution for a series when the standard deviation is known. The mean is calculated using the arithmetic mean of the XValues of the given series.
- Sample FilenameNormalDistribution.aspx
- Version3.4
- Uses DatabaseNo