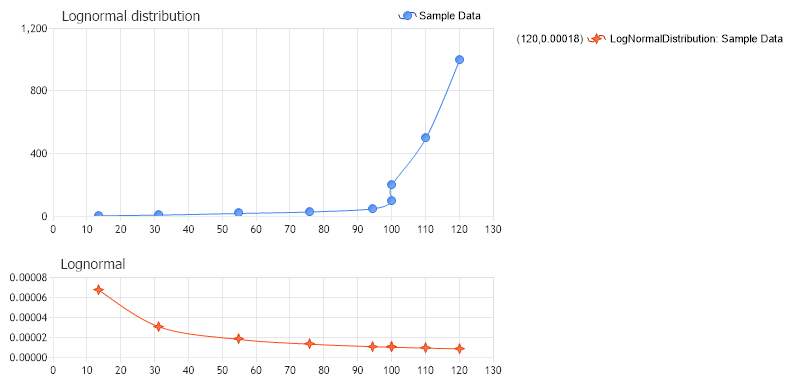
Log Normal Distribution
Demonstrates the use of LognormalDistribution method from the StatisticalEngine. This method return the lognormal distribution for a series when the standard deviation is known.
<%@ Page Language="C#" Description="dotnetCHARTING Component" %>
<%@ Register TagPrefix="dotnet" Namespace="dotnetCHARTING" Assembly="dotnetCHARTING"%>
<%@ Import Namespace="System.Drawing" %>
<html xmlns="http://www.w3.org/1999/xhtml">
<head>
<title>.netCHARTING Sample</title>
<script runat="server">
void Page_Load(Object sender,EventArgs e)
{
// Demonstrates the use of LognormalDistribution method from the StatisticalEngine. This method return the lognormal distribution for a series when the standard deviation is known.
// The Probability Chart
ProbabilityChart.Title="Lognormal distribution";
ProbabilityChart.TempDirectory="temp";
ProbabilityChart.Debug=true;
ProbabilityChart.Size = "800x400";
ProbabilityChart.LegendBox.Template ="%icon %name";
//ProbabilityChart.XAxis.Scale = Scale.Normal;
ProbabilityChart.TitleBox.Position = TitleBoxPosition.FullWithLegend;
ProbabilityChart.DefaultSeries.DefaultElement.Marker.Visible = true;
ProbabilityChart.DefaultSeries.Type = SeriesType.Spline;
ProbabilityChart.ChartAreaLayout.Mode = ChartAreaLayoutMode.Vertical;
SeriesCollection sprobability = new SeriesCollection();
// Generate the sample data.
Series sampledata1 = new Series ("Sample Data");
sampledata1.Elements.Add (new Element("",13.5,5.0));
sampledata1.Elements.Add (new Element("",31.3,10.0));
sampledata1.Elements.Add (new Element("",54.8,20.0));
sampledata1.Elements.Add (new Element("",75.9,30.0));
sampledata1.Elements.Add (new Element("",94.3,50.0));
sampledata1.Elements.Add (new Element("",99.9,100.0));
sampledata1.Elements.Add (new Element("",100.0,200.0));
sampledata1.Elements.Add (new Element("",110.0,500.0));
sampledata1.Elements.Add (new Element("",120.0,1000.0));
sprobability.Add (sampledata1);
// Add the series collection to the chart
ProbabilityChart.SeriesCollection.Add(sprobability);
// Create a new chart area for the lognormal distribution.
ChartArea lognormalChartArea = new ChartArea ("Lognormal");
lognormalChartArea.HeightPercentage = 30;
lognormalChartArea.YAxis = new Axis();
lognormalChartArea.XAxis = new Axis();
ProbabilityChart.ExtraChartAreas.Add (lognormalChartArea);
// The second parameter of this method is the standard deviation of the normal probability distribution
Series lognormalDistribution = StatisticalEngine.LognormalDistribution(sampledata1, 33);
lognormalDistribution.Type = SeriesType.Spline;
lognormalDistribution.DefaultElement.ToolTip = "Y:%YValue";
lognormalChartArea.SeriesCollection.Add (lognormalDistribution);
}
</script>
</head>
<body>
<div style="text-align:center">
<dotnet:Chart id="ProbabilityChart" runat="server"/>
</div>
</body>
</html>
<%@ Page Language="vb" Description="dotnetCHARTING Component" %>
<%@ Register TagPrefix="dotnet" Namespace="dotnetCHARTING" Assembly="dotnetCHARTING"%>
<%@ Import Namespace="System.Drawing" %>
<html xmlns="http://www.w3.org/1999/xhtml">
<head>
<title>.netCHARTING Sample</title>
<script runat="server">
Sub Page_Load(ByVal sender As Object, ByVal e As EventArgs)
' Demonstrates the use of LognormalDistribution method from the StatisticalEngine. This method return the lognormal distribution for a series when the standard deviation is known.
' The Probability Chart
ProbabilityChart.Title="Lognormal distribution"
ProbabilityChart.TempDirectory="temp"
ProbabilityChart.Debug=True
ProbabilityChart.Size = "800x400"
ProbabilityChart.LegendBox.Template ="%icon %name"
'ProbabilityChart.XAxis.Scale = Scale.Normal;
ProbabilityChart.TitleBox.Position = TitleBoxPosition.FullWithLegend
ProbabilityChart.DefaultSeries.DefaultElement.Marker.Visible = True
ProbabilityChart.DefaultSeries.Type = SeriesType.Spline
ProbabilityChart.ChartAreaLayout.Mode = ChartAreaLayoutMode.Vertical
Dim sprobability As SeriesCollection = New SeriesCollection()
' Generate the sample data.
Dim sampledata1 As Series = New Series ("Sample Data")
sampledata1.Elements.Add (New Element("",13.5,5.0))
sampledata1.Elements.Add (New Element("",31.3,10.0))
sampledata1.Elements.Add (New Element("",54.8,20.0))
sampledata1.Elements.Add (New Element("",75.9,30.0))
sampledata1.Elements.Add (New Element("",94.3,50.0))
sampledata1.Elements.Add (New Element("",99.9,100.0))
sampledata1.Elements.Add (New Element("",100.0,200.0))
sampledata1.Elements.Add (New Element("",110.0,500.0))
sampledata1.Elements.Add (New Element("",120.0,1000.0))
sprobability.Add (sampledata1)
' Add the series collection to the chart
ProbabilityChart.SeriesCollection.Add(sprobability)
' Create a new chart area for the lognormal distribution.
Dim lognormalChartArea As ChartArea = New ChartArea ("Lognormal")
lognormalChartArea.HeightPercentage = 30
lognormalChartArea.YAxis = New Axis()
lognormalChartArea.XAxis = New Axis()
ProbabilityChart.ExtraChartAreas.Add (lognormalChartArea)
' The second parameter of this method is the standard deviation of the normal probability distribution
Dim lognormalDistribution As Series = StatisticalEngine.LognormalDistribution(sampledata1, 33)
lognormalDistribution.Type = SeriesType.Spline
lognormalDistribution.DefaultElement.ToolTip = "Y:%YValue"
lognormalChartArea.SeriesCollection.Add (lognormalDistribution)
End Sub
</script>
</head>
<body>
<div style="text-align:center">
<dotnet:Chart id="ProbabilityChart" runat="server"/>
</div>
</body>
</html>