Gallery
True Range
<%@ Page Language="C#" Description="dotnetCHARTING Component" %>
<%@ Register TagPrefix="dotnet" Namespace="dotnetCHARTING" Assembly="dotnetCHARTING"%>
<%@ Import Namespace="System.Drawing" %>
<html xmlns="http://www.w3.org/1999/xhtml">
<head>
<title>.netCHARTING Financial TrueRange Sample</title>
<script runat="server">
void Page_Load(Object sender,EventArgs e)
{
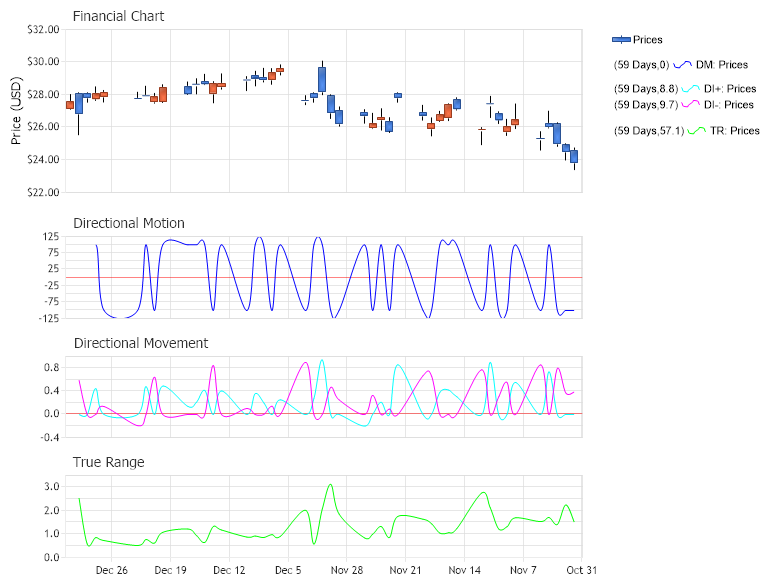
// Demonstrates the use of the TrueRange and DirectionalMotion indicators
// First we declare a chart of type FinancialChart
FinancialChart.Title="Financial Chart";
FinancialChart.TempDirectory="temp";
FinancialChart.Debug=true;
FinancialChart.ShadingEffect = true;
FinancialChart.LegendBox.Template ="%icon %name";
FinancialChart.Size="800X600";
FinancialChart.XAxis.Scale = Scale.Time;
FinancialChart.XAxis.Minimum = new DateTime(2021, 10, 30,23,59,59);
FinancialChart.XAxis.FormatString = "MMM d";
FinancialChart.XAxis.TimeInterval = TimeInterval.Week;
// For financial indicators the time scale is inverted (i.e. the first element of the series is the newest)
FinancialChart.XAxis.InvertScale = true;
FinancialChart.YAxis.Label.Text = "Price (USD)";
FinancialChart.YAxis.FormatString = "currency";
FinancialChart.YAxis.ScaleRange.ValueLow = 22;
FinancialChart.YAxis.ScaleRange.ValueHigh = 32;
// Here we load data samples from the FinancialDELL table from within chartsample.mdb
DataEngine priceDataEngine = new DataEngine ();
priceDataEngine.ChartType = ChartType.Financial;
priceDataEngine.ConnectionString = ConfigurationManager.AppSettings["DNCConnectionString"];
priceDataEngine.DateGrouping = TimeInterval.Day;
priceDataEngine.StartDate = new DateTime (2021,11,1);
priceDataEngine.EndDate = new DateTime (2021,12,31);
priceDataEngine.SqlStatement = @"SELECT TransDate, HighPrice, LowPrice, OpenPrice, ClosePrice FROM FinancialCompany WHERE TransDate >= #STARTDATE# AND TransDate <= #ENDDATE# ORDER BY TransDate ";
priceDataEngine.DataFields = "xAxis=TransDate,High=HighPrice,Low=LowPrice,Open=OpenPrice,Close=ClosePrice";
SeriesCollection sc = priceDataEngine.GetSeries ();
Series prices = null;
if(sc.Count>0)
prices = sc[0];
else
return;
prices.DefaultElement.ToolTip="L:%Low-H:%High";
prices.DefaultElement.SmartLabel.Font = new Font("Arial", 6);
prices.DefaultElement.SmartLabel.Text="O:%Open-C:%Close";
prices.Type = SeriesTypeFinancial.CandleStick;
CalendarPattern cp = new CalendarPattern (TimeInterval.Day, TimeInterval.Week, "1000001");
cp.AdjustmentUnit = TimeInterval.Day;
prices.Trim (cp, ElementValue.XDateTime);
prices.Name = "Prices";
FinancialChart.SeriesCollection.Add (prices);
FinancialChart.DefaultSeries.DefaultElement.Marker = new ElementMarker (ElementMarkerType.None);
FinancialChart.ChartAreaLayout.Mode = ChartAreaLayoutMode.Vertical;
FinancialChart.DefaultSeries.Type = SeriesType.Spline;
// Create a new chart area for DM and TrueRange indicators.
ChartArea dmChartArea = new ChartArea ("Directional Motion");
dmChartArea.HeightPercentage = 20;
dmChartArea.YAxis = new Axis();
dmChartArea.YAxis.ZeroTick.GridLine.Color = Color.FromArgb(125, 255, 0, 0);
//dmChartArea.XAxis.Line.Color = Color.Blue;
FinancialChart.ExtraChartAreas.Add (dmChartArea);
// Create a new chart area for DM+ and DM- indicators.
ChartArea dmMovementChartArea = new ChartArea ("Directional Movement");
dmMovementChartArea.HeightPercentage =20;
dmMovementChartArea.YAxis = new Axis();
dmMovementChartArea.YAxis.ScaleRange.ValueLow = -0.4;
dmMovementChartArea.YAxis.ScaleRange.ValueHigh = 1;
dmMovementChartArea.YAxis.ZeroTick.GridLine.Color = Color.FromArgb(125, 255, 0, 0);
FinancialChart.ExtraChartAreas.Add (dmMovementChartArea);
ChartArea trChartArea = new ChartArea ("True Range");
trChartArea.HeightPercentage = 20;
trChartArea.YAxis = new Axis();
trChartArea.YAxis.ScaleRange.ValueLow = 0.0;
trChartArea.YAxis.ScaleRange.ValueHigh = 3.5;
FinancialChart.ExtraChartAreas.Add (trChartArea);
// Here we display the TrueRange
Series trueRange = dotnetCHARTING.FinancialEngine.TrueRange (prices);
trueRange.Type = SeriesType.Spline;
trueRange.DefaultElement.Color = Color.FromArgb(0, 255, 0);
if (trueRange.Elements.Count > 0)
trChartArea.SeriesCollection.Add (trueRange);
else Response.Write ("The series trueRange is empty");
// Here we display the DM
Series sDM = dotnetCHARTING.FinancialEngine.DirectionalMotion (prices);
sDM.Type = SeriesType.Spline;
sDM.DefaultElement.Color = Color.FromArgb(0, 0, 255);
if (sDM.Elements.Count > 0)
dmChartArea.SeriesCollection.Add (sDM);
else Response.Write ("The series sDM is empty");
// Here we display the DM+
Series sDMPlus = dotnetCHARTING.FinancialEngine.PlusDirectionalMovement (prices);
sDMPlus.Type = SeriesType.Spline;
sDMPlus.DefaultElement.Color = Color.FromArgb(0, 255, 255);
if (sDMPlus.Elements.Count > 0)
dmMovementChartArea.SeriesCollection.Add (sDMPlus);
else Response.Write ("The series sDMPlus is empty");
// Here we display the DM-
Series sDMinus = dotnetCHARTING.FinancialEngine.MinusDirectionalMovement (prices);
sDMinus.Type = SeriesType.Spline;
sDMinus.DefaultElement.Color = Color.FromArgb(255, 0, 255);
if (sDMinus.Elements.Count > 0)
dmMovementChartArea.SeriesCollection.Add (sDMinus);
else Response.Write ("The series sDMinus is empty");
}
</script>
</head>
<body>
<center>
<dotnet:Chart id="FinancialChart" runat="server"/>
</center>
</body>
</html>
<%@ Page Language="vb" Description="dotnetCHARTING Component" %>
<%@ Register TagPrefix="dotnet" Namespace="dotnetCHARTING" Assembly="dotnetCHARTING"%>
<%@ Import Namespace="System.Drawing" %>
<html xmlns="http://www.w3.org/1999/xhtml">
<head>
<title>.netCHARTING Financial TrueRange Sample</title>
<script runat="server">
Sub Page_Load(ByVal sender As Object, ByVal e As EventArgs)
' Demonstrates the use of the TrueRange and DirectionalMotion indicators
' First we declare a chart of type FinancialChart
FinancialChart.Title="Financial Chart"
FinancialChart.TempDirectory="temp"
FinancialChart.Debug=True
FinancialChart.ShadingEffect = True
FinancialChart.LegendBox.Template ="%icon %name"
FinancialChart.Size="800X600"
FinancialChart.XAxis.Scale = Scale.Time
FinancialChart.XAxis.Minimum = New DateTime(2021, 10, 30,23,59,59)
FinancialChart.XAxis.FormatString = "MMM d"
FinancialChart.XAxis.TimeInterval = TimeInterval.Week
' For financial indicators the time scale is inverted (i.e. the first element of the series is the newest)
FinancialChart.XAxis.InvertScale = True
FinancialChart.YAxis.Label.Text = "Price (USD)"
FinancialChart.YAxis.FormatString = "currency"
FinancialChart.YAxis.ScaleRange.ValueLow = 22
FinancialChart.YAxis.ScaleRange.ValueHigh = 32
' Here we load data samples from the FinancialDELL table from within chartsample.mdb
Dim priceDataEngine As DataEngine = New DataEngine ()
priceDataEngine.ChartType = ChartType.Financial
priceDataEngine.ConnectionString = ConfigurationManager.AppSettings("DNCConnectionString")
priceDataEngine.DateGrouping = TimeInterval.Day
priceDataEngine.StartDate = New DateTime (2021,11,1)
priceDataEngine.EndDate = New DateTime (2021,12,31)
priceDataEngine.SqlStatement = "SELECT TransDate, HighPrice, LowPrice, OpenPrice, ClosePrice FROM FinancialCompany WHERE TransDate >= #STARTDATE# AND TransDate <= #ENDDATE# ORDER BY TransDate "
priceDataEngine.DataFields = "xAxis=TransDate,High=HighPrice,Low=LowPrice,Open=OpenPrice,Close=ClosePrice"
Dim sc As SeriesCollection = priceDataEngine.GetSeries ()
Dim prices As Series = Nothing
If sc.Count>0 Then
prices = sc(0)
Else
Return
End If
prices.DefaultElement.ToolTip="L:%Low-H:%High"
prices.DefaultElement.SmartLabel.Font = New Font("Arial", 6)
prices.DefaultElement.SmartLabel.Text="O:%Open-C:%Close"
prices.Type = SeriesTypeFinancial.CandleStick
Dim cp As CalendarPattern = New CalendarPattern (TimeInterval.Day, TimeInterval.Week, "1000001")
cp.AdjustmentUnit = TimeInterval.Day
prices.Trim (cp, ElementValue.XDateTime)
prices.Name = "Prices"
FinancialChart.SeriesCollection.Add (prices)
FinancialChart.DefaultSeries.DefaultElement.Marker = New ElementMarker (ElementMarkerType.None)
FinancialChart.ChartAreaLayout.Mode = ChartAreaLayoutMode.Vertical
FinancialChart.DefaultSeries.Type = SeriesType.Spline
' Create a new chart area for DM and TrueRange indicators.
Dim dmChartArea As ChartArea = New ChartArea ("Directional Motion")
dmChartArea.HeightPercentage = 20
dmChartArea.YAxis = New Axis()
dmChartArea.YAxis.ZeroTick.GridLine.Color = Color.FromArgb(125, 255, 0, 0)
'dmChartArea.XAxis.Line.Color = Color.Blue;
FinancialChart.ExtraChartAreas.Add (dmChartArea)
' Create a new chart area for DM+ and DM- indicators.
Dim dmMovementChartArea As ChartArea = New ChartArea ("Directional Movement")
dmMovementChartArea.HeightPercentage =20
dmMovementChartArea.YAxis = New Axis()
dmMovementChartArea.YAxis.ScaleRange.ValueLow = -0.4
dmMovementChartArea.YAxis.ScaleRange.ValueHigh = 1
dmMovementChartArea.YAxis.ZeroTick.GridLine.Color = Color.FromArgb(125, 255, 0, 0)
FinancialChart.ExtraChartAreas.Add (dmMovementChartArea)
Dim trChartArea As ChartArea = New ChartArea ("True Range")
trChartArea.HeightPercentage = 20
trChartArea.YAxis = New Axis()
trChartArea.YAxis.ScaleRange.ValueLow = 0.0
trChartArea.YAxis.ScaleRange.ValueHigh = 3.5
FinancialChart.ExtraChartAreas.Add (trChartArea)
' Here we display the TrueRange
Dim trueRange As Series = dotnetCHARTING.FinancialEngine.TrueRange (prices)
trueRange.Type = SeriesType.Spline
trueRange.DefaultElement.Color = Color.FromArgb(0, 255, 0)
If trueRange.Elements.Count > 0 Then
trChartArea.SeriesCollection.Add (trueRange)
Else
Response.Write ("The series trueRange is empty")
End If
' Here we display the DM
Dim sDM As Series = dotnetCHARTING.FinancialEngine.DirectionalMotion (prices)
sDM.Type = SeriesType.Spline
sDM.DefaultElement.Color = Color.FromArgb(0, 0, 255)
If sDM.Elements.Count > 0 Then
dmChartArea.SeriesCollection.Add (sDM)
Else
Response.Write ("The series sDM is empty")
End If
' Here we display the DM+
Dim sDMPlus As Series = dotnetCHARTING.FinancialEngine.PlusDirectionalMovement (prices)
sDMPlus.Type = SeriesType.Spline
sDMPlus.DefaultElement.Color = Color.FromArgb(0, 255, 255)
If sDMPlus.Elements.Count > 0 Then
dmMovementChartArea.SeriesCollection.Add (sDMPlus)
Else
Response.Write ("The series sDMPlus is empty")
End If
' Here we display the DM-
Dim sDMinus As Series = dotnetCHARTING.FinancialEngine.MinusDirectionalMovement (prices)
sDMinus.Type = SeriesType.Spline
sDMinus.DefaultElement.Color = Color.FromArgb(255, 0, 255)
If sDMinus.Elements.Count > 0 Then
dmMovementChartArea.SeriesCollection.Add (sDMinus)
Else
Response.Write ("The series sDMinus is empty")
End If
End Sub
</script>
</head>
<body>
<center>
<dotnet:Chart id="FinancialChart" runat="server"/>
</center>
</body>
</html>
- Sample FilenameTrueRange.aspx
- Version4.0
- Uses DatabaseYes