- JS Quadrant
Demonstrates how to draw a quadrants on the chart area.
- Diet DB
Demonstrates real world combination chart with independently bound axis.
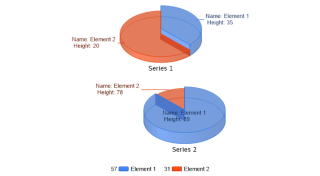
- Color Blind Pie
Demonstrates how to apply markers to the data when differences in color are not visible.
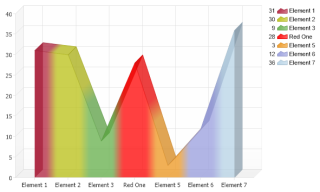
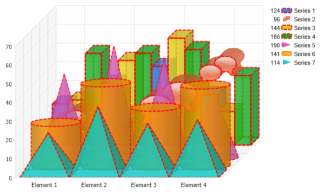
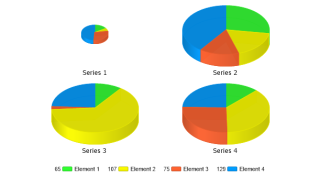
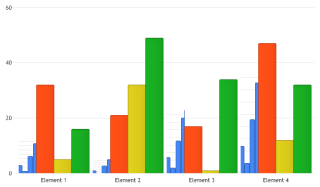
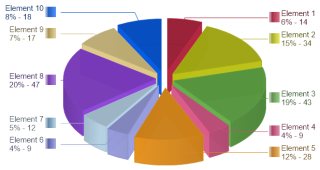
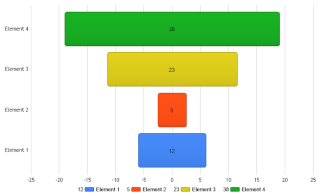
- Color By Elements
Demonstrates displaying each element in a series with different colors.
- Multi Color Area
Demonstrates how you can color an element in each series.
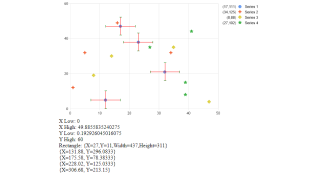
- Element Error Bars
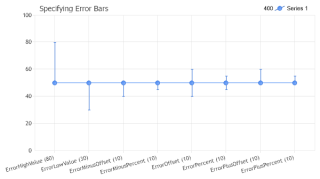
Setting a common error value of elements on a chart.
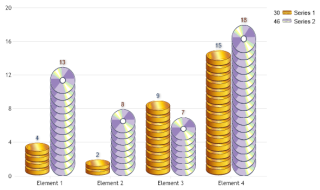
- Element Markers
Demonstrates using image markers on elements and in the legend.
- Element Sub Value Styling
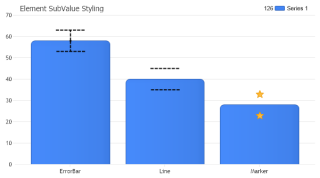
Style element sub values such as error bars.
- Empty Elements 1
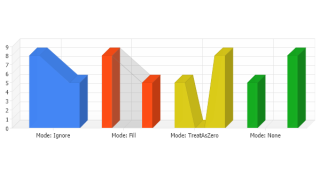
Advanced empty element handling.
- Empty Elements 2
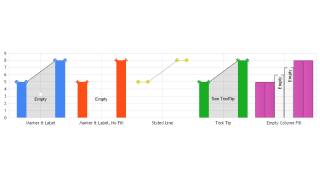
Advanced empty element handling.
- Radar Angles
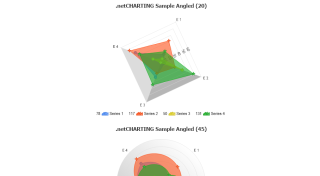
Demonstrates using orientation angles with polar and spider radar charts.
- Radar Background
Manipulate individual radar backgrounds.
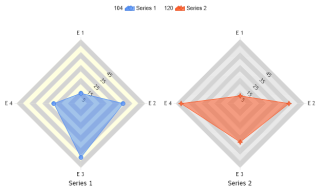
- Radar Mode
Demonstrates using polar and spider radar charts.
- Difference Series
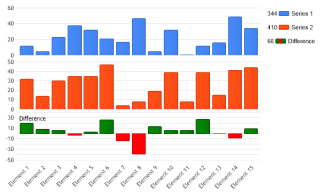
How a calculated series can be created and placed in a chart area.
- Padding
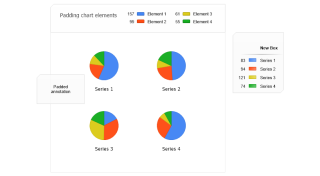
Pad different parts of the chart.
- Take Color From
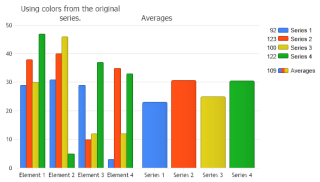
Demonstrates how to mark resulting calculated elements with colors of the original series.
- Version History
Shows .netCHARTING version history with a scatter chart.
- Invisible Element Markers
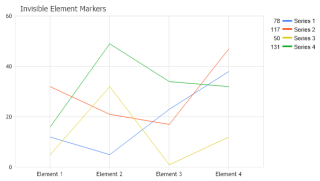
Demonstrates how to quickly make element markers invisible.
- Invisible Elements
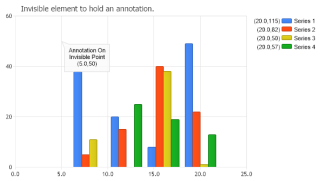
Demonstrates how an invisible element can be used to draw an annotation on the chart area at an exact axis value position.
- Spline Tension
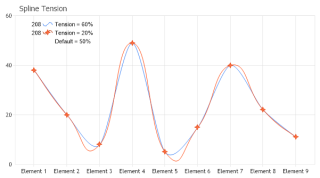
Demonstrates different settings for the tension of a spline curve.
- Math Function Plot
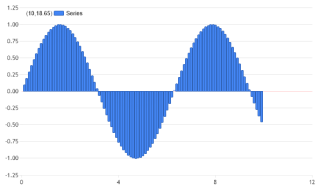
Demonstrates plotting a mathematical function. In this case, y = sin(x).
- Pie Heights
Demonstrates using pie slice height and showing the height value in the label.
- Manual Error Bars
Demonstrates drawing custom error bars on a chart image manually.
- Smart Color Gradient
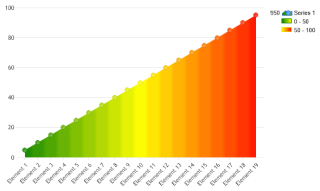
Demonstrates using gradient smartColors which shade an element based on its value with the smartColor's range.
- Element Borders
Demonstrates styling element borders and outlines.
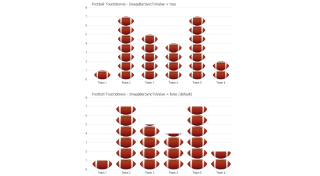
- Image Bar One To One
Demonstrates using the ImageBarSyncToValue feature where the image bars repeat the same number of times as represented by the element's value.
- Image Bar One To One 3
Demonstrates using the ImageBarSyncToValue feature where the image bars repeat the same number of times as represented by the element's value.
- Sun Bubbles
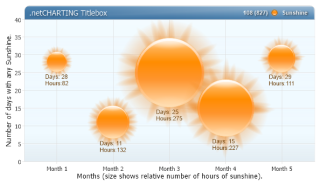
Demonstrates bubbles with ShadingEffectMode.Five, corner customization, titlebox shading and more.
- Radar Absolute Position
Demonstrates absolutely positioning a single radar amongst multiple radars.
- Radar Custom Size
Demonstrates specifying a static size for a single radar amongst multiple radars.
- Pie Outlined
Demonstrates using element outlines with a pie chart.
- Pie Absolute Position
Demonstrates absolutely positioning a single pie amongst multiple pies.
- Pie Custom Size
Demonstrates specifying a static size for a single pie amongst multiple pies.
- Diff Element Counts Per Axis Tick
Demonstrates how to create a chart with element groups with different number of elements per group.
- Small Chart Mode
Demonstrates using Chart.SmallChartMode.
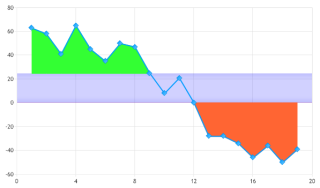
- CAQuadrants
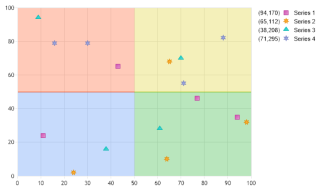
Demonstrates using AreaLine series to draw four quadrants on the chart.
- Element Coordinates With Images
Demonstrates getting the coordinates of elements after the chart is rendered and doing some drawing before the chart is saved.
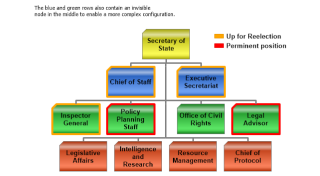
- Org Shading
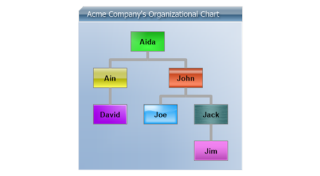
Demonstrates usage of an organizational chart using custom attributes populated from an existing user table by adding instance and parent IDs to establish the org hierarchy.
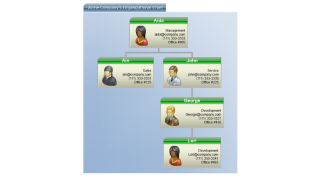
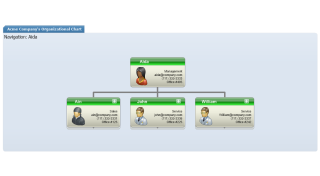
- Org DB
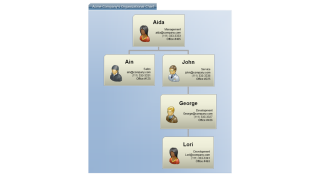
Demonstrates usage of an organizational chart using custom attributes populated from an existing user table by adding instance and parent IDs to establish the org hierarchy.
- Org DB Simple
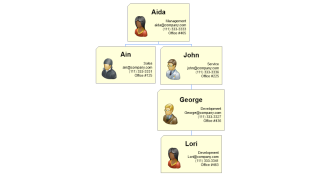
Demonstrates usage of an organizational chart using custom attributes populated from an existing user table by adding instance and parent IDs to establish the org hierarchy.
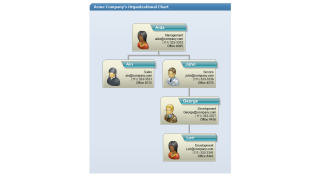
- Org Header DB
Demonstrates usage of an organizational chart using custom attributes populated from an existing user table by adding instance and parent IDs to establish the org hierarchy.
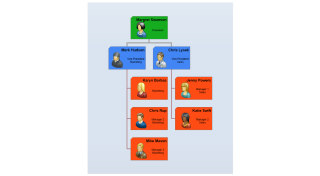
- Org Complex
Demonstrates setting up an organizational chart with invisible nodes.
- Org Label Layout
Demonstrates manually creating an organizational chart using label styling.
- Org Label Layout Vertical
Demonstrates a manually populated organization chart where the last level is listed vertically due to image size constraints.
- Pie Chart Complex Label
Demonstrates a dynamic image generated by the chart embedded in labels.
- Sub Value Bar
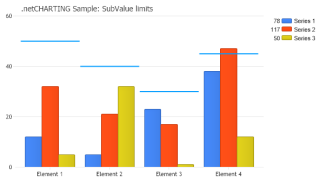
Demonstrates using subvalues to draw limit lines above a group of bars.
- Line Series Caps
Demonstrates using line caps on 2D line series.
- Pie Angles
Demonstrates setting a starting angle for pies.
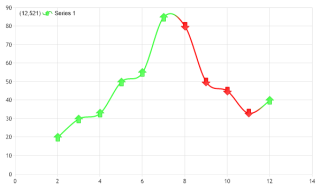
- AreaLine Peaks
Demonstrates using multiple area line series to highlight ranges.
- Arrow Element Markers
Demonstrates the up and down arrow markers.
- Wind Direction
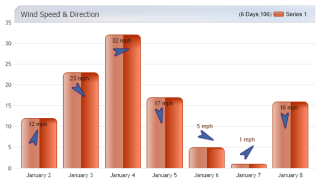
Demonstrates using an image inside a label and rotating it based on element data.
- Pyramid Centered
Demonstrates how to create a certain type of pyramid chart.
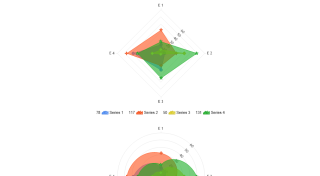
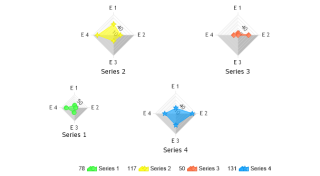
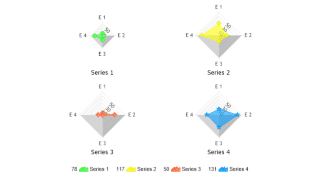
- Radar Quadrants
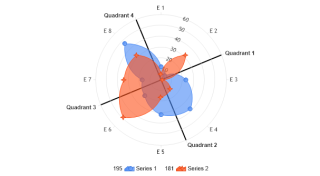
Demonstrates dividing a radar graph into quadrants.
- Org Breadcrumbs
Demonstrates using breadcrumbs of organizational nodes.
- Org Complex 2
Demonstrates setting up an organizational chart with invisible nodes.
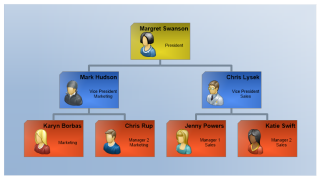
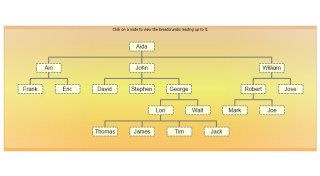
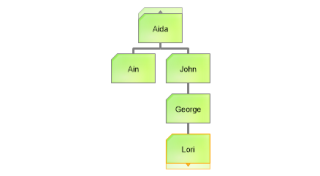
- Org Db Clean
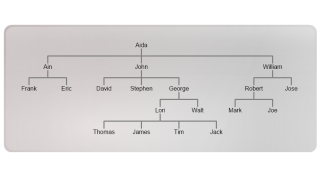
Demonstrates making a simple tree organizational chart using the DB.
- Org Designer
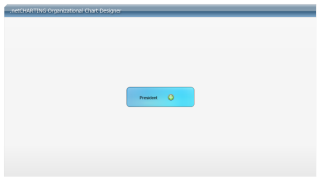
Demonstrates creating an organizational chart designer.
- Org Drill Down DB
Demonstrates organizational drill-down using the Series.
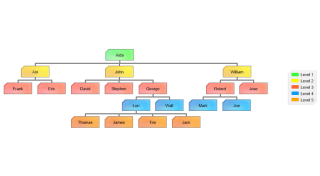
- Org Groups
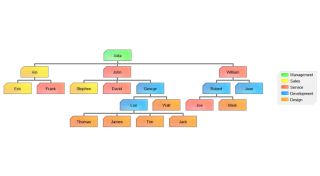
Demonstrates color coding organizational nodes based on the department.
- Org Groups 2
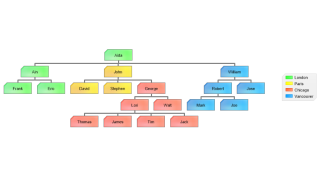
Demonstrates color coding organizational nodes from a database based on the location.
- Org Indicators
Demonstrates manually adding attributes to draw organizational nodes differently.
- Org Levels
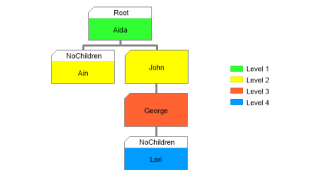
Demonstrates using the Series.Trim method to figure out the organizational level each node is on.
- Org Levels 2
Demonstrates using the Series.Trim method to figure out the organizational level each node is on.
- Org Header DB 2
Demonstrates using an organizational chart with styled headers and custom attributes populated from an existing user table by adding instance and parent IDs to establish the org hierarchy.
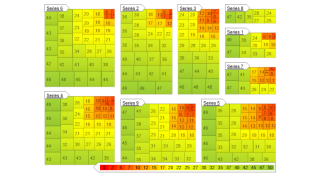
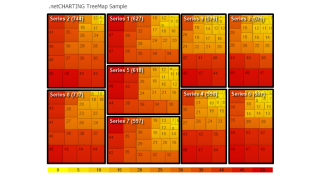
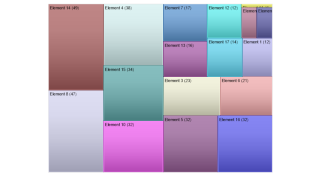
- Tree Map DB
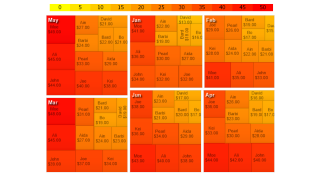
Demonstrates getting live treeMap data with multiple series.
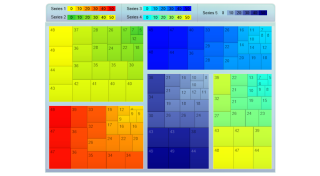
- Tree Map DB Multi Color Swatch
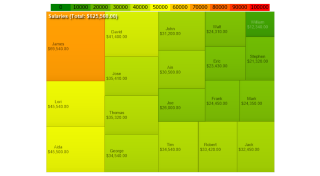
Demonstrates using a TreeMap chart with live data and a multi range color SmartPalette.
- Tree Map Element Labeling
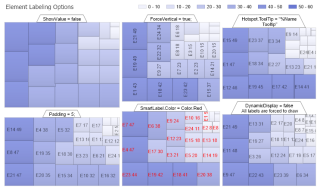
Demonstrates using a single smart palette for all series and indivisual element label options.
- Tree Map Interactive
Demonstrates an interactive TreeMap chart that shows treemap detail for series.
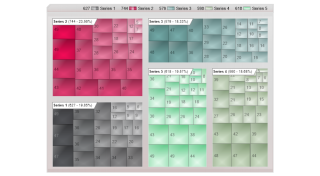
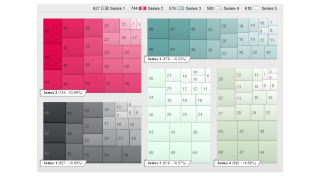
- Tree Map Legend Swatches
Demonstrates a TreeMap with individual color swatches for each series.
- Tree Map Outlined
Demonstrates a TreeMap chart with a color swatch and a microChart scale inside the legendbox. It also demonstrates series box styling.
- Tree Map Shaded
Demonstrates a TreeMap chart where each series uses a different color range to color encode the element values.
- Tree Map Simple
Demonstrates how to draw a simple TreeMap chart with color ranges using a SmartPalette.
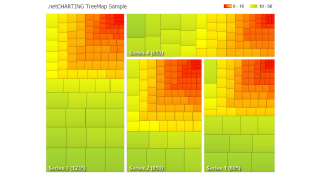
- Tree Map Single
Demonstrates a TreeMap chart with a single series using a series palette.
- Tree Map Ribbon
Demonstrates a TreeMap chart where each series uses a different color range to color encode the element values.
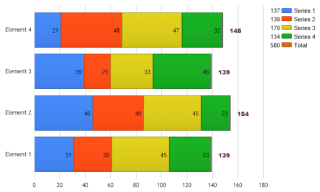
- Stacked Limit Bars
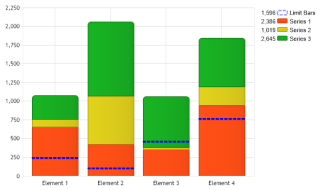
Demonstrates how to overlay a styled line or bar on a stacked bar chart.
- Faux Line Shadow
Demonstrates how a line series drop shadow can be emulated.
- Stack Total Horizontal
Demonstrates how to label the total values of horizontal column stacks.
- Legacy Vs New Defaults
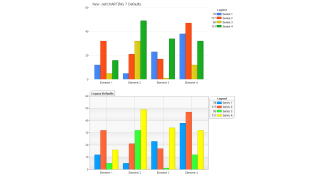
Demonstrates new defaults vs legacy defaults before version 7.