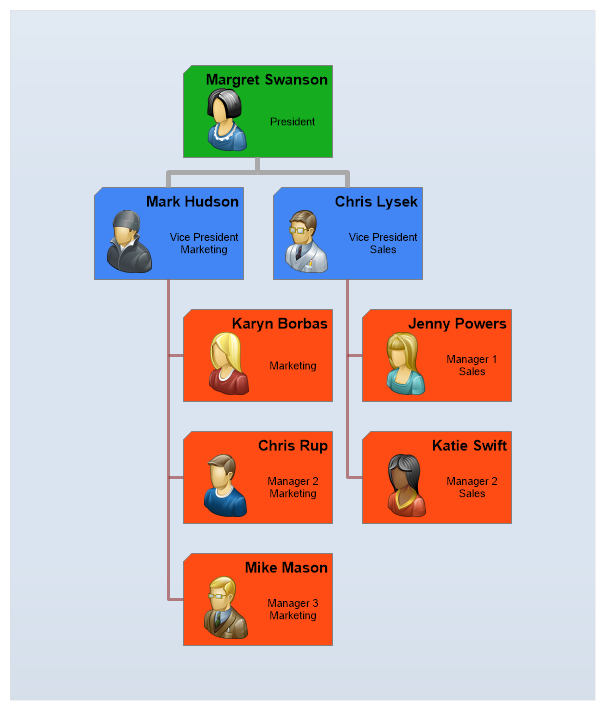
Org Label Layout Vertical
Demonstrates a manually populated organization chart where the last level is listed vertically due to image size constraints.
<%@ Page Language="C#" Description="dotnetCHARTING Component" %>
<%@ Register TagPrefix="dotnet" Namespace="dotnetCHARTING" Assembly="dotnetCHARTING" %>
<%@ Import Namespace="System.Drawing" %>
<script runat="server">
Color [] palette = ChartPalettes.GetPalette(Palette.Default);
void Page_Load(Object sender, EventArgs e)
{
// Demonstrates a manually populated organization chart where the last level is listed vertically due to image size constraints.
Chart.TempDirectory = "temp";
Chart.Debug = true;
Chart.Type = ChartType.Organizational;
Chart.Size = "600x700";
Chart.TitleBox.Position = TitleBoxPosition.Full;
Chart.DefaultSeries.Line.Width = 5;
Chart.DefaultSeries.Line.Color = Color.DarkGray;
//Chart.ChartArea.Background.ShadingEffectMode = ShadingEffectMode.Five;
Chart.ChartArea.Background.Color = Color.FromArgb(125, Color.FromArgb(180,200,224));
Chart.DefaultElement.Annotation = new Annotation();
Chart.DefaultElement.Annotation.Label.Alignment = StringAlignment.Center;
//Chart.DefaultElement.Annotation.Background.ShadingEffectMode = ShadingEffectMode.Six;
Chart.DefaultElement.Annotation.Background.Color = palette[3];
Chart.DefaultElement.Annotation.Padding = 5;
Chart.ChartArea.Padding = 30;
SeriesCollection mySC = getData();
// Add the random data.
Chart.SeriesCollection.Add(mySC);
}
SeriesCollection getData()
{
// Initialize elements
Element p1 = new Element("<block hAlign='right' fStyle='bold' fSize='11'>Margret Swanson<row><img:../../images/Org7.png>President");
Element vp1 = new Element("<block hAlign='right' fStyle='bold' fSize='11'>Mark Hudson<row><img:../../images/Org1.png>Vice President<br>Marketing");
Element vp2 = new Element("<block hAlign='right' fStyle='bold' fSize='11'>Chris Lysek<row><img:../../images/Org2.png>Vice President<br>Sales");
Element mm1 = new Element("<block hAlign='right' fStyle='bold' fSize='11'>Karyn Borbas<row><img:../../images/Org4.png>Marketing");
Element mm2 = new Element("<block hAlign='right' fStyle='bold' fSize='11'>Chris Rup<row><img:../../images/Org6.png>Manager 2<br>Marketing");
Element mm3 = new Element("<block hAlign='right' fStyle='bold' fSize='11'>Mike Mason<row><img:../../images/Org3.png>Manager 3<br>Marketing");
Element ms1 = new Element("<block hAlign='right' fStyle='bold' fSize='11'>Jenny Powers<row><img:../../images/Org8.png>Manager 1<br>Sales");
Element ms2 = new Element("<block hAlign='right' fStyle='bold' fSize='11'>Katie Swift<row><img:../../images/Org9.png>Manager 2<br>Sales");
// Set relationships.
vp1.Parent = p1;
vp2.Parent = p1;
mm1.Parent = vp1;
mm2.Parent = vp1;
mm3.Parent = vp1;
ms1.Parent = vp2;
ms2.Parent = vp2;
Series vpS = new Series("", vp1, vp2);
Series managers = new Series("", mm1, mm2,mm3, ms1, ms2);
Series President = new Series("",p1);
managers.DefaultElement.Annotation = new Annotation();
managers.DefaultElement.Annotation.Background.Color = palette[1];
managers.Line.Color = Color.FromArgb(150, 150, 50, 50);
managers.Line.Width = 3;
vpS.DefaultElement.Annotation = new Annotation();
vpS.DefaultElement.Annotation.Background.Color = palette[0];
SeriesCollection scSolo = new SeriesCollection(President,vpS,managers);
return scSolo;
}
</script>
<html xmlns="http://www.w3.org/1999/xhtml">
<head>
<title>.netCHARTING Sample</title>
</head>
<body>
<div align="center">
<dotnet:Chart ID="Chart" runat="server" />
</div>
</body>
</html>
<%@ Page Language="vb" Description="dotnetCHARTING Component" %>
<%@ Register TagPrefix="dotnet" Namespace="dotnetCHARTING" Assembly="dotnetCHARTING" %>
<%@ Import Namespace="System.Drawing" %>
<script runat="server">
Dim palette As Color() = ChartPalettes.GetPalette(dotnetCHARTING.Palette.Default)
Sub Page_Load(ByVal sender As Object, ByVal e As EventArgs)
' Demonstrates a manually populated organization chart where the last level is listed vertically due to image size constraints.
Chart.TempDirectory = "temp"
Chart.Debug = True
Chart.Type = ChartType.Organizational
Chart.Size = "600x700"
Chart.TitleBox.Position = TitleBoxPosition.Full
Chart.DefaultSeries.Line.Width = 5
Chart.DefaultSeries.Line.Color = Color.DarkGray
'Chart.ChartArea.Background.ShadingEffectMode = ShadingEffectMode.Five;
Chart.ChartArea.Background.Color = Color.FromArgb(125, Color.FromArgb(180,200,224))
Chart.DefaultElement.Annotation = New Annotation()
Chart.DefaultElement.Annotation.Label.Alignment = StringAlignment.Center
'Chart.DefaultElement.Annotation.Background.ShadingEffectMode = ShadingEffectMode.Six;
Chart.DefaultElement.Annotation.Background.Color = palette(3)
Chart.DefaultElement.Annotation.Padding = 5
Chart.ChartArea.Padding = 30
Dim mySC As SeriesCollection = getData()
' Add the random data.
Chart.SeriesCollection.Add(mySC)
End Sub
Function getData() As SeriesCollection
' Initialize elements
Dim p1 As Element = New Element("<block hAlign='right' fStyle='bold' fSize='11'>Margret Swanson<row><img:../../images/Org7.png>President")
Dim vp1 As Element = New Element("<block hAlign='right' fStyle='bold' fSize='11'>Mark Hudson<row><img:../../images/Org1.png>Vice President<br>Marketing")
Dim vp2 As Element = New Element("<block hAlign='right' fStyle='bold' fSize='11'>Chris Lysek<row><img:../../images/Org2.png>Vice President<br>Sales")
Dim mm1 As Element = New Element("<block hAlign='right' fStyle='bold' fSize='11'>Karyn Borbas<row><img:../../images/Org4.png>Marketing")
Dim mm2 As Element = New Element("<block hAlign='right' fStyle='bold' fSize='11'>Chris Rup<row><img:../../images/Org6.png>Manager 2<br>Marketing")
Dim mm3 As Element = New Element("<block hAlign='right' fStyle='bold' fSize='11'>Mike Mason<row><img:../../images/Org3.png>Manager 3<br>Marketing")
Dim ms1 As Element = New Element("<block hAlign='right' fStyle='bold' fSize='11'>Jenny Powers<row><img:../../images/Org8.png>Manager 1<br>Sales")
Dim ms2 As Element = New Element("<block hAlign='right' fStyle='bold' fSize='11'>Katie Swift<row><img:../../images/Org9.png>Manager 2<br>Sales")
' Set relationships.
vp1.Parent = p1
vp2.Parent = p1
mm1.Parent = vp1
mm2.Parent = vp1
mm3.Parent = vp1
ms1.Parent = vp2
ms2.Parent = vp2
Dim vpS As Series = New Series("", vp1, vp2)
Dim managers As Series = New Series("", mm1, mm2,mm3, ms1, ms2)
Dim President As Series = New Series("",p1)
managers.DefaultElement.Annotation = New Annotation()
managers.DefaultElement.Annotation.Background.Color = palette(1)
managers.Line.Color = Color.FromArgb(150, 150, 50, 50)
managers.Line.Width = 3
vpS.DefaultElement.Annotation = New Annotation()
vpS.DefaultElement.Annotation.Background.Color = palette(0)
Dim scSolo As SeriesCollection = New SeriesCollection(President,vpS,managers)
Return scSolo
End Function
</script>
<html xmlns="http://www.w3.org/1999/xhtml">
<head>
<title>.netCHARTING Sample</title>
</head>
<body>
<div align="center">
<dotnet:Chart ID="Chart" runat="server" />
</div>
</body>
</html>