// This sample wil demonstrate how you can color an element in each series so you can do without the x axis.
// First we get our data, if you would like to get the data from a database you need to use // the data engine. See sample: features/dataEngine.aspx. Series mySeries = getRandomData();
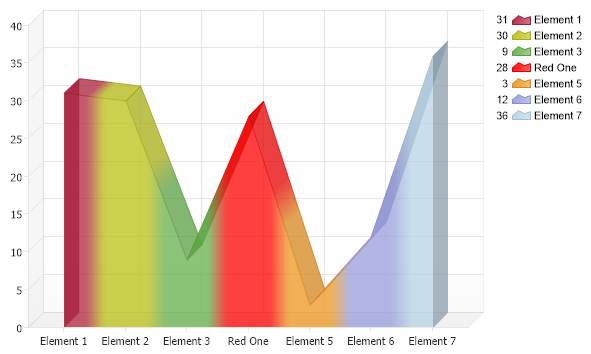
// By setting a palette to this series it will instruct the chart engine to color each of it's elements // and place each element into the legend and remove the series. mySeries.PaletteName = Palette.Three;
// We can also mark any element with any color. mySeries.Elements[3].Color = Color.Red; mySeries.Elements[3].Name = "Red One";
// Set the default series type to area line. Chart.DefaultSeries.Type = SeriesType.AreaLine;
// A bit transparency almost always makes the chart look better so we add some here. Chart.DefaultSeries.DefaultElement.Transparency = 25;
// Add the random data. Chart.SeriesCollection.Add(mySeries);
}
Series getRandomData() { Random myR = new Random();
Series s = new Series(); s.Name = "Clicks"; for(int b = 1; b < 8; b++) { Element e = new Element(); e.Name = "Element " + b;; e.YValue = myR.Next(50); s.Elements.Add(e); }
' This sample wil demonstrate how you can color an element in each series so you can do without the x axis.
' First we get our data, if you would like to get the data from a database you need to use ' the data engine. See sample: features/dataEngine.aspx. Dim mySeries As Series = getRandomData()
' By setting a palette to this series it will instruct the chart engine to color each of it's elements ' and place each element into the legend and remove the series. mySeries.PaletteName = Palette.Three
' We can also mark any element with any color. mySeries.Elements(3).Color = Color.Red mySeries.Elements(3).Name = "Red One"
' Set the default series type to area line. Chart.DefaultSeries.Type = SeriesType.AreaLine
' A bit transparency almost always makes the chart look better so we add some here. Chart.DefaultSeries.DefaultElement.Transparency = 25
' Add the random data. Chart.SeriesCollection.Add(mySeries)
End Sub
Function getRandomData() As Series Dim myR As Random = New Random()
Dim s As Series = New Series() s.Name = "Clicks" For b As Integer = 1 To 7 Dim e As Element = New Element() e.Name = "Element " & b