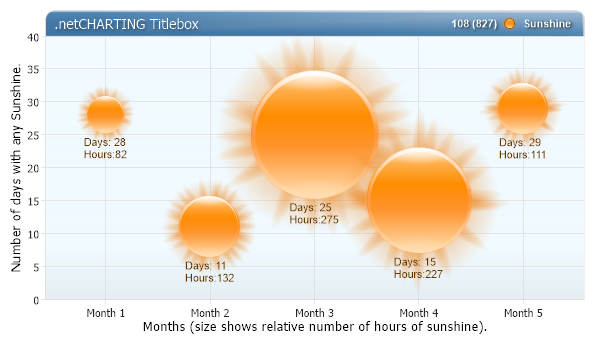
Sun Bubbles
Demonstrates bubbles with ShadingEffectMode.Five, corner customization, titlebox shading and more.
<%@ Page Language="C#" Description="dotnetCHARTING Component" %>
<%@ Register TagPrefix="dotnet" Namespace="dotnetCHARTING" Assembly="dotnetCHARTING" %>
<%@ Import Namespace="System.Drawing" %>
<%@ Import Namespace="System.Drawing.Drawing2D" %>
<script runat="server">
void Page_Load(Object sender, EventArgs e)
{
// Demonstrates bubbles with ShadingEffectMode.Five, corner customization, titlebox shading and more.
Chart.Type = ChartType.Combo;//Horizontal;
Chart.Size = "600x350";
Chart.TempDirectory = "temp";
Chart.Debug = true;
Chart.Title = "Monthly Sunshine Analysis";
Chart.DefaultSeries.Type = SeriesType.Bubble;
Chart.DefaultSeries.DefaultElement.ShowValue = true;
Chart.DefaultElement.Color = Color.DarkOrange; //Color.FromArgb(200,100,100);
Chart.DefaultElement.SmartLabel.Text = "Days: %Value\r\nHours:%BubbleSize";
// Bubble using ShadingEffectMode.Five
Chart.ShadingEffectMode = ShadingEffectMode.Five;
// Axis Settings
Chart.YAxis.Minimum = 0;
Chart.YAxis.Label.Text = "Number of days with any Sunshine.";
Chart.XAxis.Label.Text = "Months (size shows relative number of hours of sunshine).";
// TitleBox Customization
Chart.TitleBox.Label.Text = ".netCHARTING Titlebox";
Chart.TitleBox.Label.Color = Color.White;
Chart.TitleBox.Label.Shadow.Color = Color.FromArgb(105, 0, 0, 0);
Chart.TitleBox.Label.Shadow.Depth = 2;
Chart.TitleBox.Position = TitleBoxPosition.FullWithLegend;
Chart.TitleBox.CornerTopLeft = BoxCorner.Round;
Chart.TitleBox.CornerTopRight = BoxCorner.Round;
Chart.TitleBox.Background.ShadingEffectMode = ShadingEffectMode.Five;
Chart.TitleBox.Background.Color = Color.SteelBlue;
//Corner Size Customization (in pixels)
Chart.DefaultBox.CornerSize = 4;
Chart.TitleBox.CornerSize = 20;
Chart.ChartArea.Background.Color = Color.FromArgb(255, 240, 250, 255);
Chart.YAxis.AlternateGridBackground.Color = Color.FromArgb(100, 230, 240, 255);
// Legend Box Label Customization
Chart.LegendBox.LabelStyle.Color = Color.White;
Chart.LegendBox.LabelStyle.Font = new Font("Arial", 8, FontStyle.Bold);
Chart.LegendBox.LabelStyle.Shadow.Depth = 2;
Chart.LegendBox.LabelStyle.Shadow.Color = Color.FromArgb(200, 0, 0, 0);
// *DYNAMIC DATA NOTE*
// This sample uses random data to populate the chart. To populate
// a chart with database data see the following resources:
// - Classic samples folder
// - Help File > Data Tutorials
// - Sample: features/DataEngine.aspx
SeriesCollection mySC = getRandomData();
// Add the random data.
Chart.SeriesCollection.Add(mySC);
}
SeriesCollection getRandomData()
{
SeriesCollection SC = new SeriesCollection();
Random myR = new Random(8);
for (int a = 1; a < 2; a++)
{
Series s = new Series();
s.Name = "Sunshine";
for (int b = 1; b < 6; b++)
{
Element e = new Element();
e.YValue = myR.Next(31);
e.BubbleSize = myR.Next(500);
e.Name = "Month " + b.ToString();
s.Elements.Add(e);
}
SC.Add(s);
}
return SC;
}
</script>
<html xmlns="http://www.w3.org/1999/xhtml">
<head>
<title>.netCHARTING Sample</title>
</head>
<body>
<div style="text-align: center">
<dotnet:Chart ID="Chart" runat="server" />
</div>
</body>
</html>
<%@ Page Language="vb" Description="dotnetCHARTING Component" %>
<%@ Register TagPrefix="dotnet" Namespace="dotnetCHARTING" Assembly="dotnetCHARTING" %>
<%@ Import Namespace="System.Drawing" %>
<%@ Import Namespace="System.Drawing.Drawing2D" %>
<script runat="server">
Sub Page_Load(ByVal sender As Object, ByVal e As EventArgs)
' Demonstrates bubbles with ShadingEffectMode.Five, corner customization, titlebox shading and more.
Chart.Type = ChartType.Combo 'Horizontal;
Chart.Size = "600x350"
Chart.TempDirectory = "temp"
Chart.Debug = True
Chart.Title = "Monthly Sunshine Analysis"
Chart.DefaultSeries.Type = SeriesType.Bubble
Chart.DefaultSeries.DefaultElement.ShowValue = True
Chart.DefaultElement.Color = Color.DarkOrange 'Color.FromArgb(200,100,100);
Chart.DefaultElement.SmartLabel.Text = "Days: %Value" & Constants.vbCrLf & "Hours:%BubbleSize"
' Bubble using ShadingEffectMode.Five
Chart.ShadingEffectMode = ShadingEffectMode.Five
' Axis Settings
Chart.YAxis.Minimum = 0
Chart.YAxis.Label.Text = "Number of days with any Sunshine."
Chart.XAxis.Label.Text = "Months (size shows relative number of hours of sunshine)."
' TitleBox Customization
Chart.TitleBox.Label.Text = ".netCHARTING Titlebox"
Chart.TitleBox.Label.Color = Color.White
Chart.TitleBox.Label.Shadow.Color = Color.FromArgb(105, 0, 0, 0)
Chart.TitleBox.Label.Shadow.Depth = 2
Chart.TitleBox.Position = TitleBoxPosition.FullWithLegend
Chart.TitleBox.CornerTopLeft = BoxCorner.Round
Chart.TitleBox.CornerTopRight = BoxCorner.Round
Chart.TitleBox.Background.ShadingEffectMode = ShadingEffectMode.Five
Chart.TitleBox.Background.Color = Color.SteelBlue
'Corner Size Customization (in pixels)
Chart.DefaultBox.CornerSize = 4
Chart.TitleBox.CornerSize = 20
Chart.ChartArea.Background.Color = Color.FromArgb(255, 240, 250, 255)
Chart.YAxis.AlternateGridBackground.Color = Color.FromArgb(100, 230, 240, 255)
' Legend Box Label Customization
Chart.LegendBox.LabelStyle.Color = Color.White
Chart.LegendBox.LabelStyle.Font = New Font("Arial", 8, FontStyle.Bold)
Chart.LegendBox.LabelStyle.Shadow.Depth = 2
Chart.LegendBox.LabelStyle.Shadow.Color = Color.FromArgb(200, 0, 0, 0)
' *DYNAMIC DATA NOTE*
' This sample uses random data to populate the chart. To populate
' a chart with database data see the following resources:
' - Classic samples folder
' - Help File > Data Tutorials
' - Sample: features/DataEngine.aspx
Dim mySC As SeriesCollection = getRandomData()
' Add the random data.
Chart.SeriesCollection.Add(mySC)
End Sub
Function getRandomData() As SeriesCollection
Dim SC As SeriesCollection = New SeriesCollection()
Dim myR As Random = New Random(8)
For a As Integer = 1 To 1
Dim s As Series = New Series()
s.Name = "Sunshine"
For b As Integer = 1 To 5
Dim e As Element = New Element()
e.YValue = myR.Next(31)
e.BubbleSize = myR.Next(500)
e.Name = "Month " & b.ToString()
s.Elements.Add(e)
Next b
SC.Add(s)
Next a
Return SC
End Function
</script>
<html xmlns="http://www.w3.org/1999/xhtml">
<head>
<title>.netCHARTING Sample</title>
</head>
<body>
<div style="text-align: center">
<dotnet:Chart ID="Chart" runat="server" />
</div>
</body>
</html>