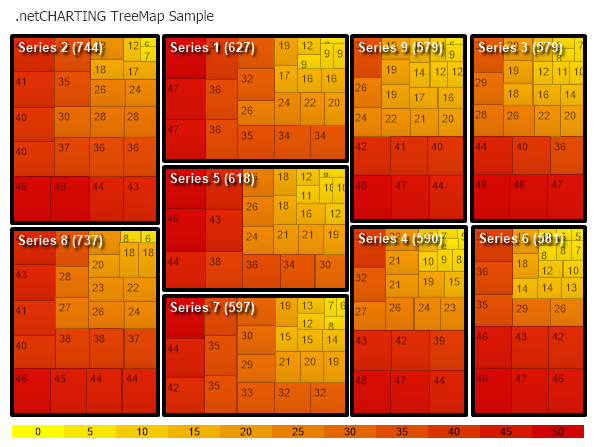
Tree Map Outlined
Demonstrates a TreeMap chart with a color swatch and a microChart scale inside the legendbox. It also demonstrates series box styling.
<%@ Page Language="C#" Description="dotnetCHARTING Component" %>
<%@ Register TagPrefix="dnc" Namespace="dotnetCHARTING" Assembly="dotnetCHARTING" %>
<%@ Import Namespace="System.Drawing" %>
<script runat="server">
void Page_Load(Object sender, EventArgs e)
{
// Demonstrates a TreeMap chart with a color swatch and a microChart scale inside the legendbox. It also demonstrates series box styling.
Chart.Size = "600x450";
Chart.Title = ".netCHARTING TreeMap Sample";
Chart.TempDirectory = "temp";
Chart.Debug = true;
Chart.Type = ChartType.TreeMap;
Chart.ChartAreaSpacing = 0;
Chart.LegendBox.DefaultEntry.Visible = false;
Chart.LegendBox.Orientation = dotnetCHARTING.Orientation.Bottom;
// Distance between series boxes
Chart.ChartArea.Padding = 6;
// Series Label: The series box label settings can be used to control the default series labels.
Chart.DefaultSeries.Box.Label.Color = Color.White;
Chart.DefaultSeries.Box.Label.Shadow.Color = Color.Black;
Chart.DefaultSeries.Box.Label.Shadow.Depth = 3;
Chart.DefaultSeries.Box.Label.LineAlignment = StringAlignment.Near;
Chart.DefaultSeries.Box.Label.Text = "%Name (%YSum)";
Chart.DefaultSeries.Box.Label.Font = new Font("Arial", 10, FontStyle.Bold);
//Element labels and tooltip
Chart.DefaultElement.ToolTip = "%Name";
Chart.DefaultElement.ShowValue = true;
Chart.DefaultElement.SmartLabel.DynamicDisplay = false;
// *DYNAMIC DATA NOTE*
// This sample uses random data to populate the chart. To populate
// a chart with database data see the following resources:
// - Use the getLiveData() method using the dataEngine to query a database.
// - Help File > Getting Started > Data Tutorials
// - DataEngine Class in the help file
// - Sample: features/DataEngine.aspx
SeriesCollection mySC = getRandomData();
// Add the random data.
Chart.SeriesCollection.Add(mySC);
// Series Box Styling
Chart.DefaultSeries.Box.Line.Color = Color.Black;
Chart.DefaultSeries.Box.Line.Width = 4;
// Setup a SmartPalette Color Range
Chart.SmartPalette.Add("*", new SmartColor(Color.Yellow, Color.FromArgb(211, 0, 0), new ScaleRange(0, 50)));
// The color swatch is placed in the legendbox header.
Chart.LegendBox.HeaderLabel.Text = getSwatch(490, Chart.SmartPalette, 10, true);
Chart.LegendBox.ClearColors();
}
string getSwatch(int width, SmartPalette sp, int divisions, bool withValues)
{
// Get Maximum Value of the smart palette range
double max = (double)sp.GetScaleRange("*").ValueHigh;
string swatch = "", spacers = "";
// Width of each division.
int boxWidth = width / divisions;
// Generate swatch string for each division.
for (int i = 0; i <= divisions; i++)
{
spacers += "<Chart:Spacer size='" + boxWidth + "x1'>";
// Get the color of the current division.
string color = getHTMLColor(sp.GetValueColor("", (i * (max / divisions))));
if (withValues)
swatch += "<block bgColor='" + color + "'>" + (i * (max / divisions));
else
swatch += "<block bgColor='" + color + "' fColor='" + color + "'>_";
}
//return the swatch string.
return spacers + "<row>" + swatch;
}
string getHTMLColor(Color c)
{
return "#" + c.R.ToString("X2") + c.G.ToString("X2") + c.B.ToString("X2");
}
SeriesCollection getRandomData()
{
Random myR = new Random(1);
SeriesCollection SC = new SeriesCollection();
for (int a = 1; a < 10; a++)
{
Series s = new Series("Series " + a.ToString());
for (int b = 1; b < 25; b++)
{
Element e = new Element("Element " + b.ToString());
e.YValue = 5 + myR.Next(45);
s.Elements.Add(e);
}
SC.Add(s);
}
return SC;
}
SeriesCollection getLiveData()
{
DataEngine de = new DataEngine(ConfigurationManager.AppSettings["DNCConnectionString"]);
de.ChartObject = Chart; // Necessary to view any errors the dataEngine may throw.
de.SqlStatement = "SELECT XAxisColumn, YAxisColumn FROM ....";
return de.GetSeries();
}
</script>
<html xmlns="http://www.w3.org/1999/xhtml">
<head>
<title>.netCHARTING Sample</title>
</head>
<body>
<div align="center">
<dnc:Chart ID="Chart" runat="server" />
</div>
</body>
</html>
<%@ Page Language="vb" Description="dotnetCHARTING Component" %>
<%@ Register TagPrefix="dnc" Namespace="dotnetCHARTING" Assembly="dotnetCHARTING" %>
<%@ Import Namespace="System.Drawing" %>
<script runat="server">
Sub Page_Load(ByVal sender As Object, ByVal e As EventArgs)
' Demonstrates a TreeMap chart with a color swatch and a microChart scale inside the legendbox. It also demonstrates series box styling.
Chart.Size = "600x450"
Chart.Title = ".netCHARTING TreeMap Sample"
Chart.TempDirectory = "temp"
Chart.Debug = True
Chart.Type = ChartType.TreeMap
Chart.ChartAreaSpacing = 0
Chart.LegendBox.DefaultEntry.Visible = False
Chart.LegendBox.Orientation = dotnetCHARTING.Orientation.Bottom
' Distance between series boxes
Chart.ChartArea.Padding = 6
' Series Label: The series box label settings can be used to control the default series labels.
Chart.DefaultSeries.Box.Label.Color = Color.White
Chart.DefaultSeries.Box.Label.Shadow.Color = Color.Black
Chart.DefaultSeries.Box.Label.Shadow.Depth = 3
Chart.DefaultSeries.Box.Label.LineAlignment = StringAlignment.Near
Chart.DefaultSeries.Box.Label.Text = "%Name (%YSum)"
Chart.DefaultSeries.Box.Label.Font = New Font("Arial", 10, FontStyle.Bold)
'Element labels and tooltip
Chart.DefaultElement.ToolTip = "%Name"
Chart.DefaultElement.ShowValue = True
Chart.DefaultElement.SmartLabel.DynamicDisplay = False
' *DYNAMIC DATA NOTE*
' This sample uses random data to populate the chart. To populate
' a chart with database data see the following resources:
' - Use the getLiveData() method using the dataEngine to query a database.
' - Help File > Getting Started > Data Tutorials
' - DataEngine Class in the help file
' - Sample: features/DataEngine.aspx
Dim mySC As SeriesCollection = getRandomData()
' Add the random data.
Chart.SeriesCollection.Add(mySC)
' Series Box Styling
Chart.DefaultSeries.Box.Line.Color = Color.Black
Chart.DefaultSeries.Box.Line.Width = 4
' Setup a SmartPalette Color Range
Chart.SmartPalette.Add("*", New SmartColor(Color.Yellow, Color.FromArgb(211, 0, 0), New ScaleRange(0, 50)))
' The color swatch is placed in the legendbox header.
Chart.LegendBox.HeaderLabel.Text = getSwatch(490, Chart.SmartPalette, 10, True)
Chart.LegendBox.ClearColors()
End Sub
Function getSwatch(ByVal width As Integer, ByVal sp As SmartPalette, ByVal divisions As Integer, ByVal withValues As Boolean) As String
' Get Maximum Value of the smart palette range
Dim max As Double = CDbl(sp.GetScaleRange("*").ValueHigh)
Dim swatch As String = "", spacers As String = ""
' Width of each division.
Dim boxWidth As Integer = width / divisions
' Generate swatch string for each division.
For i As Integer = 0 To divisions
spacers &= "<Chart:Spacer size='" & boxWidth & "x1'>"
' Get the color of the current division.
Dim color As String = getHTMLColor(sp.GetValueColor("", (i * (max / divisions))))
If withValues Then
swatch &= "<block bgColor='" & color & "'>" & (i * (max / divisions))
Else
swatch &= "<block bgColor='" & color & "' fColor='" & color & "'>_"
End If
Next i
'return the swatch string.
Return spacers & "<row>" & swatch
End Function
Function getHTMLColor(ByVal c As Color) As String
Return "#" & c.R.ToString("X2") + c.G.ToString("X2") + c.B.ToString("X2")
End Function
Function getRandomData() As SeriesCollection
Dim myR As Random = New Random(1)
Dim SC As SeriesCollection = New SeriesCollection()
For a As Integer = 1 To 9
Dim s As Series = New Series("Series " & a.ToString())
For b As Integer = 1 To 24
Dim e As Element = New Element("Element " & b.ToString())
e.YValue = 5 + myR.Next(45)
s.Elements.Add(e)
Next b
SC.Add(s)
Next a
Return SC
End Function
Function getLiveData() As SeriesCollection
Dim de As DataEngine = New DataEngine(ConfigurationManager.AppSettings("DNCConnectionString"))
de.ChartObject = Chart ' Necessary to view any errors the dataEngine may throw.
de.SqlStatement = "SELECT XAxisColumn, YAxisColumn FROM ...."
Return de.GetSeries()
End Function
</script>
<html xmlns="http://www.w3.org/1999/xhtml">
<head>
<title>.netCHARTING Sample</title>
</head>
<body>
<div align="center">
<dnc:Chart ID="Chart" runat="server" />
</div>
</body>
</html>