Gallery
Org DB Simple
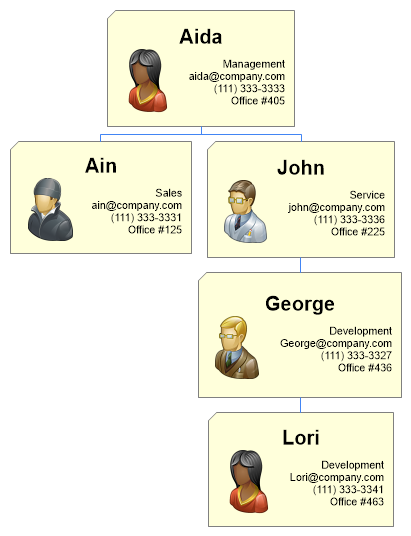
Demonstrates usage of an organizational chart using custom attributes populated from an existing user table by adding instance and parent IDs to establish the org hierarchy.
- Sample FilenameOrgDBSimple.aspx
- Version5.1
- Uses DatabaseYes