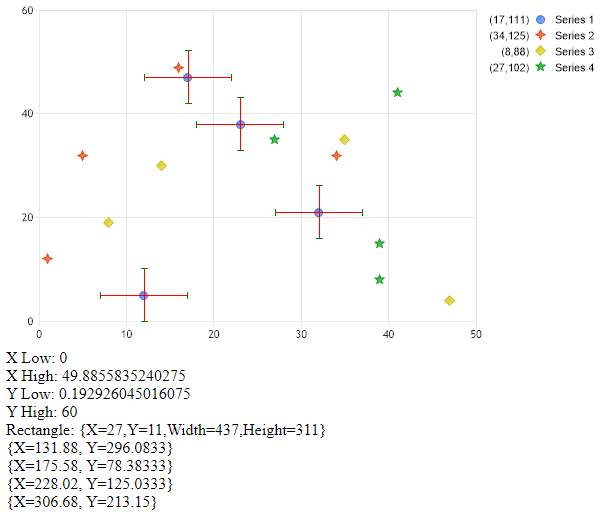
Manual Error Bars
Demonstrates drawing custom error bars on a chart image manually.
<%@ Page Language="C#" Description="dotnetCHARTING Component" %>
<%@ Register TagPrefix="dotnet" Namespace="dotnetCHARTING" Assembly="dotnetCHARTING"%>
<%@ Import Namespace="System.Drawing" %>
<%@ Import Namespace="System.Drawing.Drawing2D" %>
<%@ Import Namespace="dotnetCHARTING.Mapping" %>
<script runat="server">
void Page_Load(Object sender,EventArgs e)
{
// Demonstrates drawing custom error bars on a chart image manually.
Chart.TempDirectory = "temp";
Chart.Debug = true;
Chart.Type = ChartType.Combo;
Chart.Size = "600x350";
//Chart.Title = ".netCHARTING Sample";
Chart.DefaultSeries.Type = SeriesType.Marker;
// *DYNAMIC DATA NOTE*
// This sample uses random data to populate the chart. To populate
// a chart with database data see the following resources:
// - Help File > Getting Started > Data Tutorials
// - DataEngine Class in the help file
// - Sample: features/DataEngine.aspx
SeriesCollection mySC = getRandomData();
// Add the random data.
Chart.SeriesCollection.Add(mySC);
//Get a bitmap of the chart.
Bitmap bmp = Chart.GetChartBitmap();
// Create a graphics object from the bitmap
Graphics g = Graphics.FromImage(bmp);
// Get chart area rectangle
Point[] caPoints = Chart.ChartArea.GetCoordinates();
GraphicsPath gp = new GraphicsPath();
gp.AddPolygon(caPoints);
RectangleF caRect = gp.GetBounds();
gp.Dispose();
// Get axis ranges
double xLow = (double)Chart.XAxis.GetValueAtX(((int)caRect.Left+1).ToString() + ",100");
double xHigh = (double)Chart.XAxis.GetValueAtX(((int)caRect.Right ).ToString() + ",100");
// Get axis ranges
double yHigh = (double)Chart.YAxis.GetValueAtY( "100,"+((int)caRect.Top+1).ToString());
double yLow = (double)Chart.YAxis.GetValueAtY("100," + ((int)caRect.Bottom ).ToString());
label1.Text = "X Low: " + xLow.ToString() + "<br> X High: " + xHigh.ToString();
label1.Text += "<BR>Y Low: " + yLow.ToString() + "<br> Y High: " + yHigh.ToString();
label1.Text += "<BR> Rectangle: " + caRect.ToString();
foreach (Element el in mySC[0].Elements)
{
label1.Text += "<BR> " + el.Point.ToString();
}
float xStep = caRect.Width / (float)(xHigh - xLow);
float yStep = caRect.Height / (float)(yHigh - yLow);
int xOffset = 5;
int yOffset = 5;
// After the chart is generated, the element's positions are available.
// Lets iterate the elements we have added and make an array of these positions.
Series s = mySC[0];
Point[] points = new Point[s.Elements.Count];
for (int i = 0; i < s.Elements.Count; i++)
{
points[i] = Point.Round(s.Elements[i].Point);
Point p1 = new Point((int)(points[i].X + xOffset * xStep), (int)points[i].Y);
Point p2 =new Point((int)(points[i].X - (xOffset * xStep)), (int)points[i].Y);
Point p3 =new Point((int)points[i].X,(int)(points[i].Y + yOffset * yStep));
Point p4 = new Point((int)points[i].X, (int)(points[i].Y - (yOffset * yStep)));
// Lines
g.DrawLine(Pens.Red,Point.Round( points[i]), p1);
g.DrawLine(Pens.Red, Point.Round(points[i]), p2);
g.DrawLine(Pens.Red, Point.Round(points[i]), p3);
g.DrawLine(Pens.Red, Point.Round(points[i]), p4);
// Caps
p3.Offset(-3, 0);
Point p7 = p3;
p7.Offset(6,0);
g.DrawLine(Pens.Green, p3, p7);
p4.Offset(-3, 0);
Point p8 = p4;
p8.Offset(6, 0);
g.DrawLine(Pens.Green, p4, p8);
p2.Offset(0,-3);
Point p6 = p2;
p6.Offset(0, 6);
g.DrawLine(Pens.Green, p2, p6);
p1.Offset(0, -3);
Point p5 = p1;
p5.Offset(0, 6);
g.DrawLine(Pens.Green, p1, p5);
}
g.Dispose();
//Save the image using the FileManager.
Chart.FileManager.SaveImage(bmp);
}
SeriesCollection getRandomData()
{
Random myR = new Random(1);
SeriesCollection SC = new SeriesCollection();
for(int a = 1; a < 5; a++)
{
Series s = new Series("Series " + a.ToString());
for(int b = 1; b < 5; b++)
{
Element e = new Element("");
e.XValue = myR.Next(50);
e.YValue = myR.Next(50);
s.Elements.Add(e);
}
SC.Add(s);
}
return SC;
}
</script>
<html xmlns="http://www.w3.org/1999/xhtml">
<head><title>.netCHARTING Sample</title></head>
<body>
<div align="center">
<dotnet:Chart id="Chart" runat="server"/>
</div>
<asp:Label ID="label1" runat=server/>
</body>
</html>
<%@ Page Language="vb" Description="dotnetCHARTING Component" %>
<%@ Register TagPrefix="dotnet" Namespace="dotnetCHARTING" Assembly="dotnetCHARTING"%>
<%@ Import Namespace="System.Drawing" %>
<%@ Import Namespace="System.Drawing.Drawing2D" %>
<%@ Import Namespace="dotnetCHARTING.Mapping" %>
<script runat="server">
Sub Page_Load(ByVal sender As Object, ByVal e As EventArgs)
' Demonstrates drawing custom error bars on a chart image manually.
Chart.TempDirectory = "temp"
Chart.Debug = True
Chart.Type = ChartType.Combo
Chart.Size = "600x350"
'Chart.Title = ".netCHARTING Sample";
Chart.DefaultSeries.Type = SeriesType.Marker
' *DYNAMIC DATA NOTE*
' This sample uses random data to populate the chart. To populate
' a chart with database data see the following resources:
' - Help File > Getting Started > Data Tutorials
' - DataEngine Class in the help file
' - Sample: features/DataEngine.aspx
Dim mySC As SeriesCollection = getRandomData()
' Add the random data.
Chart.SeriesCollection.Add(mySC)
'Get a bitmap of the chart.
Dim bmp As Bitmap = Chart.GetChartBitmap()
' Create a graphics object from the bitmap
Dim g As Graphics = Graphics.FromImage(bmp)
' Get chart area rectangle
Dim caPoints As Point() = Chart.ChartArea.GetCoordinates()
Dim gp As GraphicsPath = New GraphicsPath()
gp.AddPolygon(caPoints)
Dim caRect As RectangleF = gp.GetBounds()
gp.Dispose()
' Get axis ranges
Dim xLow As Double = CDbl(Chart.XAxis.GetValueAtX((CInt(Fix(caRect.Left))+1).ToString() & ",100"))
Dim xHigh As Double = CDbl(Chart.XAxis.GetValueAtX((CInt(Fix(caRect.Right))).ToString() & ",100"))
' Get axis ranges
Dim yHigh As Double = CDbl(Chart.YAxis.GetValueAtY("100," & (CInt(Fix(caRect.Top))+1).ToString()))
Dim yLow As Double = CDbl(Chart.YAxis.GetValueAtY("100," & (CInt(Fix(caRect.Bottom))).ToString()))
label1.Text = "X Low: " & xLow.ToString() & "<br> X High: " & xHigh.ToString()
label1.Text &= "<BR>Y Low: " & yLow.ToString() & "<br> Y High: " & yHigh.ToString()
label1.Text &= "<BR> Rectangle: " & caRect.ToString()
For Each el As Element In mySC(0).Elements
label1.Text &= "<BR> " & el.Point.ToString()
Next el
Dim xStep As Single = caRect.Width / CSng(xHigh - xLow)
Dim yStep As Single = caRect.Height / CSng(yHigh - yLow)
Dim xOffset As Integer = 5
Dim yOffset As Integer = 5
' After the chart is generated, the element's positions are available.
' Lets iterate the elements we have added and make an array of these positions.
Dim s As Series = mySC(0)
Dim points As Point() = New Point(s.Elements.Count - 1){}
For i As Integer = 0 To s.Elements.Count - 1
points(i) = Point.Round(s.Elements(i).Point)
Dim p1 As Point = New Point(CInt(Fix(points(i).X + xOffset * xStep)), CInt(Fix(points(i).Y)))
Dim p2 As Point = New Point(CInt(Fix(points(i).X - (xOffset * xStep))), CInt(Fix(points(i).Y)))
Dim p3 As Point = New Point(CInt(Fix(points(i).X)),CInt(Fix(points(i).Y + yOffset * yStep)))
Dim p4 As Point = New Point(CInt(Fix(points(i).X)), CInt(Fix(points(i).Y - (yOffset * yStep))))
' Lines
g.DrawLine(Pens.Red,Point.Round(points(i)), p1)
g.DrawLine(Pens.Red, Point.Round(points(i)), p2)
g.DrawLine(Pens.Red, Point.Round(points(i)), p3)
g.DrawLine(Pens.Red, Point.Round(points(i)), p4)
' Caps
p3.Offset(-3, 0)
Dim p7 As Point = p3
p7.Offset(6,0)
g.DrawLine(Pens.Green, p3, p7)
p4.Offset(-3, 0)
Dim p8 As Point = p4
p8.Offset(6, 0)
g.DrawLine(Pens.Green, p4, p8)
p2.Offset(0,-3)
Dim p6 As Point = p2
p6.Offset(0, 6)
g.DrawLine(Pens.Green, p2, p6)
p1.Offset(0, -3)
Dim p5 As Point = p1
p5.Offset(0, 6)
g.DrawLine(Pens.Green, p1, p5)
Next i
g.Dispose()
'Save the image using the FileManager.
Chart.FileManager.SaveImage(bmp)
End Sub
Function getRandomData() As SeriesCollection
Dim myR As Random = New Random(1)
Dim SC As SeriesCollection = New SeriesCollection()
For a As Integer = 1 To 4
Dim s As Series = New Series("Series " & a.ToString())
For b As Integer = 1 To 4
Dim e As Element = New Element("")
e.XValue = myR.Next(50)
e.YValue = myR.Next(50)
s.Elements.Add(e)
Next b
SC.Add(s)
Next a
Return SC
End Function
</script>
<html xmlns="http://www.w3.org/1999/xhtml">
<head><title>.netCHARTING Sample</title></head>
<body>
<div align="center">
<dotnet:Chart id="Chart" runat="server"/>
</div>
<asp:Label ID="label1" runat=server/>
</body>
</html>