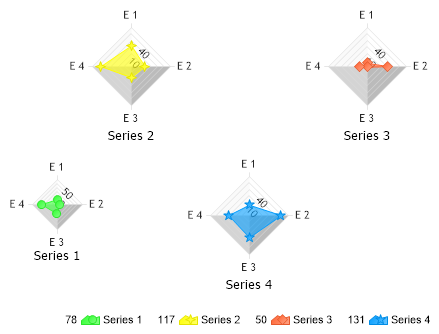
Radar Absolute Position
Demonstrates absolutely positioning a single radar amongst multiple radars.
<%@ Page Language="C#" Description="dotnetCHARTING Component" %>
<%@ Register TagPrefix="dotnet" Namespace="dotnetCHARTING" Assembly="dotnetCHARTING" %>
<%@ Import Namespace="System.Drawing" %>
<%@ Import Namespace="System.Drawing.Drawing2D" %>
<%@ Import Namespace="dotnetCHARTING.Mapping" %>
<script runat="server">
void Page_Load(Object sender, EventArgs e)
{
// Demonstrates absolutely positioning a single radar amongst multiple radars.
SetChart(Chart);
}
void SetChart(Chart c)
{
c.TempDirectory = "temp";
c.Debug = true;
c.Use3D = true;
c.Palette = new Color[] { Color.FromArgb(49, 255, 49), Color.FromArgb(255, 255, 0), Color.FromArgb(255, 99, 49), Color.FromArgb(0, 156, 255) };
c.Type = ChartType.Radars;
c.Size = "600x350";
//c.Title = ".netCHARTING Sample";
// *DYNAMIC DATA NOTE*
// This sample uses random data to populate the chart. To populate
// a chart with database data see the following resources:
// - Use the getLiveData() method using the dataEngine to query a database.
// - Help File > Getting Started > Data Tutorials
// - DataEngine Class in the help file
// - Sample: features/DataEngine.aspx
SeriesCollection mySC = getRandomData();
mySC[0].GaugeBorderBox.Position = new Rectangle(80,190, 50, 50);
//mySC[0].GaugeBorderBox.Position = new Size(50, 50);
// Add the random data.
mySC[0][0].ShowValue = true;
c.SeriesCollection.Add(mySC);
}
SeriesCollection getRandomData()
{
Random myR = new Random(1);
SeriesCollection SC = new SeriesCollection();
int a = 0;
int b = 0;
for (a = 1; a < 5; a++)
{
Series s = new Series("Series " + a.ToString());
for (b = 1; b < 5; b++)
{
Element e = new Element("E " + b.ToString());
e.YValue = myR.Next(50);
s.Elements.Add(e);
}
SC.Add(s);
}
return SC;
}
SeriesCollection getLiveData()
{
DataEngine de = new DataEngine("ConnectionString goes here");
de.ChartObject = Chart; // Necessary to view any errors the dataEngine may throw.
de.SqlStatement = "SELECT XAxisColumn, YAxisColumn FROM ....";
return de.GetSeries();
}
</script>
<html xmlns="http://www.w3.org/1999/xhtml">
<head>
<title>.netCHARTING Sample</title>
</head>
<body>
<div align="center">
<dotnet:Chart ID="Chart" runat="server" />
</div>
</body>
</html>
<%@ Page Language="vb" Description="dotnetCHARTING Component" %>
<%@ Register TagPrefix="dotnet" Namespace="dotnetCHARTING" Assembly="dotnetCHARTING" %>
<%@ Import Namespace="System.Drawing" %>
<%@ Import Namespace="System.Drawing.Drawing2D" %>
<%@ Import Namespace="dotnetCHARTING.Mapping" %>
<script runat="server">
Sub Page_Load(ByVal sender As Object, ByVal e As EventArgs)
' Demonstrates absolutely positioning a single radar amongst multiple radars.
SetChart_Renamed(Chart)
End Sub
Sub SetChart_Renamed(ByVal c As Chart)
c.TempDirectory = "temp"
c.Debug = True
c.Use3D = True
c.Palette = New Color() { Color.FromArgb(49, 255, 49), Color.FromArgb(255, 255, 0), Color.FromArgb(255, 99, 49), Color.FromArgb(0, 156, 255) }
c.Type = ChartType.Radars
c.Size = "600x350"
'c.Title = ".netCHARTING Sample";
' *DYNAMIC DATA NOTE*
' This sample uses random data to populate the chart. To populate
' a chart with database data see the following resources:
' - Use the getLiveData() method using the dataEngine to query a database.
' - Help File > Getting Started > Data Tutorials
' - DataEngine Class in the help file
' - Sample: features/DataEngine.aspx
Dim mySC As SeriesCollection = getRandomData()
mySC(0).GaugeBorderBox.Position = New Rectangle(80,190, 50, 50)
'mySC[0].GaugeBorderBox.Position = new Size(50, 50);
' Add the random data.
mySC(0)(0).ShowValue = True
c.SeriesCollection.Add(mySC)
End Sub
Function getRandomData() As SeriesCollection
Dim myR As Random = New Random(1)
Dim SC As SeriesCollection = New SeriesCollection()
Dim a As Integer = 0
Dim b As Integer = 0
For a = 1 To 4
Dim s As Series = New Series("Series " & a.ToString())
For b = 1 To 4
Dim e As Element = New Element("E " & b.ToString())
e.YValue = myR.Next(50)
s.Elements.Add(e)
Next b
SC.Add(s)
Next a
Return SC
End Function
Function getLiveData() As SeriesCollection
Dim de As DataEngine = New DataEngine("ConnectionString goes here")
de.ChartObject = Chart ' Necessary to view any errors the dataEngine may throw.
de.SqlStatement = "SELECT XAxisColumn, YAxisColumn FROM ...."
Return de.GetSeries()
End Function
</script>
<html xmlns="http://www.w3.org/1999/xhtml">
<head>
<title>.netCHARTING Sample</title>
</head>
<body>
<div align="center">
<dotnet:Chart ID="Chart" runat="server" />
</div>
</body>
</html>