Org Shading
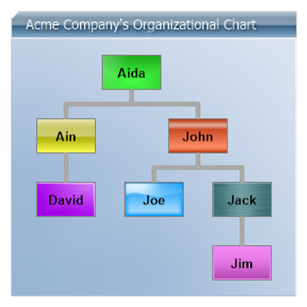
Demonstrates usage of an organizational chart using custom attributes populated from an existing user table by adding instance and parent IDs to establish the org hierarchy.
<%@ Page Language="C#" Trace="false" Description="dotnetCHARTING Component" %>
<%@ Register TagPrefix="dotnet" Namespace="dotnetCHARTING" Assembly="dotnetCHARTING" %>
<%@ Import Namespace="System.Drawing" %>
<script runat="server">
void Page_Load(Object sender, EventArgs e)
{
// Demonstrates usage of an organizational chart using custom attributes populated from an existing user table by adding instance and parent IDs to establish the org hierarchy.
// Set global properties
Chart.Type = ChartType.Organizational;
Chart.TempDirectory = "temp";
Chart.Debug = true;
Chart.Size = "300X300";
Chart.ChartArea.Background.ShadingEffectMode = ShadingEffectMode.Five;
Chart.ChartArea.Background.Color = Color.FromArgb(250, Color.FromArgb(180, 200, 224));
// TitleBox Customization
Chart.TitleBox.Label.Text = " Acme Company's Organizational Chart";
Chart.TitleBox.Label.Color = Color.White;
Chart.TitleBox.Label.Shadow.Color = Color.FromArgb(105, 0, 0, 0);
Chart.TitleBox.Label.Shadow.Depth = 2;
Chart.TitleBox.Background.ShadingEffectMode = ShadingEffectMode.Two;
Chart.TitleBox.Background.Color = Color.SteelBlue;
Chart.TitleBox.Position = TitleBoxPosition.Full;
// Set the org line style
Chart.DefaultSeries.Line.Width = 5;
Chart.DefaultSeries.Line.Color = Color.DarkGray;
// Set the org annotation visual appearance, shading and layout
Chart.DefaultElement.Annotation = new Annotation();
Chart.DefaultElement.Annotation.Label.Alignment = StringAlignment.Center;
Chart.DefaultElement.Annotation.CornerTopLeft = BoxCorner.Square;
Chart.DefaultElement.Annotation.DynamicSize = false;
Chart.DefaultElement.Annotation.Size = new Size(60, 35);
Chart.DefaultElement.Annotation.Label.Font = new Font("Arial", 10, FontStyle.Bold);
Chart.DefaultElement.Annotation.Background.ShadingEffectMode = ShadingEffectMode.Seven;
Chart.DefaultElement.Annotation.Background.Color = Chart.Palette[2];
Chart.DefaultElement.Annotation.Padding = 10;
// Controls the padding of the annotations within the chart area
Chart.ChartArea.Padding = 30;
SeriesCollection sc = getData();
// Set the shading effect mode and color for each element.
sc[0].Elements[0].Annotation = new Annotation();
sc[0].Elements[0].Annotation.Background.ShadingEffectMode = ShadingEffectMode.One;
sc[0].Elements[0].Annotation.Background.Color = Color.FromArgb(49, 255, 49);
sc[0].Elements[1].Annotation = new Annotation();
sc[0].Elements[1].Annotation.Background.ShadingEffectMode = ShadingEffectMode.Two;
sc[0].Elements[1].Annotation.Background.Color = Color.FromArgb(255, 255, 0);
sc[0].Elements[2].Annotation = new Annotation();
sc[0].Elements[2].Annotation.Background.ShadingEffectMode = ShadingEffectMode.Three;
sc[0].Elements[2].Annotation.Background.Color = Color.FromArgb(255, 99, 49);
sc[0].Elements[3].Annotation = new Annotation();
sc[0].Elements[3].Annotation.Background.ShadingEffectMode = ShadingEffectMode.Four;
sc[0].Elements[3].Annotation.Background.Color = Color.FromArgb(0, 156, 255);
sc[0].Elements[4].Annotation = new Annotation();
sc[0].Elements[4].Annotation.Background.ShadingEffectMode = ShadingEffectMode.Five;
sc[0].Elements[4].Annotation.Background.Color = Color.FromArgb(180, 0, 255);
sc[0].Elements[5].Annotation = new Annotation();
sc[0].Elements[5].Annotation.Background.ShadingEffectMode = ShadingEffectMode.Six;
sc[0].Elements[5].Annotation.Background.Color = Color.FromArgb(0, 150, 150);
sc[0].Elements[6].Annotation = new Annotation();
sc[0].Elements[6].Annotation.Background.ShadingEffectMode = ShadingEffectMode.Seven;
sc[0].Elements[6].Annotation.Background.Color = Color.FromArgb(255, 0, 255);
Chart.SeriesCollection.Add(sc);
}
SeriesCollection getData()
{
Element e1 = new Element("Aida");
Element e2 = new Element("Ain");
Element e3 = new Element("John");
Element e4 = new Element("Joe");
Element e5 = new Element("David");
Element e6 = new Element("Jack");
Element e7 = new Element("Jim");
e2.Parent = e1;
e3.Parent = e1;
e4.Parent = e3;
e5.Parent = e2;
e6.Parent = e3;
e7.Parent = e6;
SeriesCollection sc = new SeriesCollection(new Series("", e1, e2, e3, e4, e5, e6, e7));
return sc;
}
</script>
<html>
<head>
<title>Organizational Chart Sample</title>
</head>
<body>
<div style="text-align: center">
<dotnet:Chart ID="Chart" runat="server" />
</div>
</body>
</html>
<%@ Page Language="vb" Trace="false" Description="dotnetCHARTING Component" %>
<%@ Register TagPrefix="dotnet" Namespace="dotnetCHARTING" Assembly="dotnetCHARTING" %>
<%@ Import Namespace="System.Drawing" %>
<script runat="server">
Sub Page_Load(ByVal sender As Object, ByVal e As EventArgs)
' Demonstrates usage of an organizational chart using custom attributes populated from an existing user table by adding instance and parent IDs to establish the org hierarchy.
' Set global properties
Chart.Type = ChartType.Organizational
Chart.TempDirectory = "temp"
Chart.Debug = True
Chart.Size = "300X300"
Chart.ChartArea.Background.ShadingEffectMode = ShadingEffectMode.Five
Chart.ChartArea.Background.Color = Color.FromArgb(250, Color.FromArgb(180, 200, 224))
' TitleBox Customization
Chart.TitleBox.Label.Text = " Acme Company's Organizational Chart"
Chart.TitleBox.Label.Color = Color.White
Chart.TitleBox.Label.Shadow.Color = Color.FromArgb(105, 0, 0, 0)
Chart.TitleBox.Label.Shadow.Depth = 2
Chart.TitleBox.Background.ShadingEffectMode = ShadingEffectMode.Two
Chart.TitleBox.Background.Color = Color.SteelBlue
Chart.TitleBox.Position = TitleBoxPosition.Full
' Set the org line style
Chart.DefaultSeries.Line.Width = 5
Chart.DefaultSeries.Line.Color = Color.DarkGray
' Set the org annotation visual appearance, shading and layout
Chart.DefaultElement.Annotation = New Annotation()
Chart.DefaultElement.Annotation.Label.Alignment = StringAlignment.Center
Chart.DefaultElement.Annotation.CornerTopLeft = BoxCorner.Square
Chart.DefaultElement.Annotation.DynamicSize = False
Chart.DefaultElement.Annotation.Size = New Size(60, 35)
Chart.DefaultElement.Annotation.Label.Font = New Font("Arial", 10, FontStyle.Bold)
Chart.DefaultElement.Annotation.Background.ShadingEffectMode = ShadingEffectMode.Seven
Chart.DefaultElement.Annotation.Background.Color = Chart.Palette(2)
Chart.DefaultElement.Annotation.Padding = 10
' Controls the padding of the annotations within the chart area
Chart.ChartArea.Padding = 30
Dim sc As SeriesCollection = getData()
' Set the shading effect mode and color for each element.
sc(0).Elements(0).Annotation = New Annotation()
sc(0).Elements(0).Annotation.Background.ShadingEffectMode = ShadingEffectMode.One
sc(0).Elements(0).Annotation.Background.Color = Color.FromArgb(49, 255, 49)
sc(0).Elements(1).Annotation = New Annotation()
sc(0).Elements(1).Annotation.Background.ShadingEffectMode = ShadingEffectMode.Two
sc(0).Elements(1).Annotation.Background.Color = Color.FromArgb(255, 255, 0)
sc(0).Elements(2).Annotation = New Annotation()
sc(0).Elements(2).Annotation.Background.ShadingEffectMode = ShadingEffectMode.Three
sc(0).Elements(2).Annotation.Background.Color = Color.FromArgb(255, 99, 49)
sc(0).Elements(3).Annotation = New Annotation()
sc(0).Elements(3).Annotation.Background.ShadingEffectMode = ShadingEffectMode.Four
sc(0).Elements(3).Annotation.Background.Color = Color.FromArgb(0, 156, 255)
sc(0).Elements(4).Annotation = New Annotation()
sc(0).Elements(4).Annotation.Background.ShadingEffectMode = ShadingEffectMode.Five
sc(0).Elements(4).Annotation.Background.Color = Color.FromArgb(180, 0, 255)
sc(0).Elements(5).Annotation = New Annotation()
sc(0).Elements(5).Annotation.Background.ShadingEffectMode = ShadingEffectMode.Six
sc(0).Elements(5).Annotation.Background.Color = Color.FromArgb(0, 150, 150)
sc(0).Elements(6).Annotation = New Annotation()
sc(0).Elements(6).Annotation.Background.ShadingEffectMode = ShadingEffectMode.Seven
sc(0).Elements(6).Annotation.Background.Color = Color.FromArgb(255, 0, 255)
Chart.SeriesCollection.Add(sc)
End Sub
Function getData() As SeriesCollection
Dim e1 As Element = New Element("Aida")
Dim e2 As Element = New Element("Ain")
Dim e3 As Element = New Element("John")
Dim e4 As Element = New Element("Joe")
Dim e5 As Element = New Element("David")
Dim e6 As Element = New Element("Jack")
Dim e7 As Element = New Element("Jim")
e2.Parent = e1
e3.Parent = e1
e4.Parent = e3
e5.Parent = e2
e6.Parent = e3
e7.Parent = e6
Dim sc As SeriesCollection = New SeriesCollection(New Series("", e1, e2, e3, e4, e5, e6, e7))
Return sc
End Function
</script>
<html>
<head>
<title>Organizational Chart Sample</title>
</head>
<body>
<div style="text-align: center">
<dotnet:Chart ID="Chart" runat="server" />
</div>
</body>
</html>