// *DYNAMIC DATA NOTE* // This sample uses random data to populate the chart. To populate // a chart with database data see the following resources: // - Use the getLiveData() method using the dataEngine to query a database. // - Help File > Getting Started > Data Tutorials // - DataEngine Class in the help file // - Sample: features/DataEngine.aspx
// Get the data. SeriesCollection mySC = getRandomData();
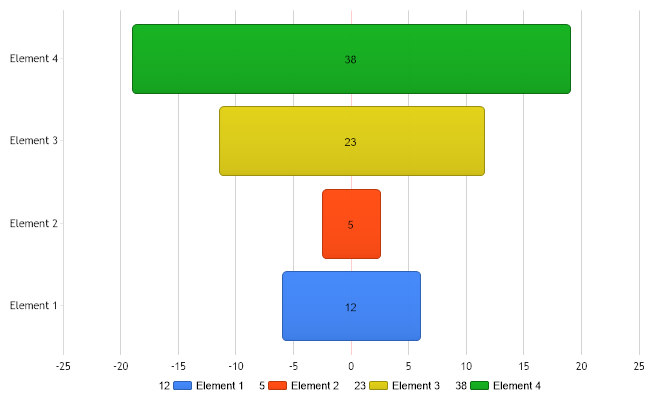
// Modify each element so that YValueStart - YValue = 0. foreach (Element el in mySC[0].Elements) { double val = el.YValue; el.YValue = val / 2; el.YValueStart = -el.YValue; }
// Add the random data. Chart.SeriesCollection.Add(mySC); }
SeriesCollection getRandomData() { Random myR = new Random(1); SeriesCollection SC = new SeriesCollection(); for (int a = 1; a < 2; a++) { Series s = new Series("Series " + a.ToString()); for (int b = 1; b < 5; b++) { Element e = new Element("Element " + b.ToString()); e.YValue = myR.Next(50); s.Elements.Add(e); } SC.Add(s); } return SC; }
SeriesCollection getLiveData() { DataEngine de = new DataEngine(ConfigurationManager.AppSettings["DNCConnectionString"]); de.ChartObject = Chart; // Necessary to view any errors the dataEngine may throw. de.SqlStatement = "SELECT XAxisColumn, YAxisColumn FROM ...."; return de.GetSeries(); }
' *DYNAMIC DATA NOTE* ' This sample uses random data to populate the chart. To populate ' a chart with database data see the following resources: ' - Use the getLiveData() method using the dataEngine to query a database. ' - Help File > Getting Started > Data Tutorials ' - DataEngine Class in the help file ' - Sample: features/DataEngine.aspx
' Get the data. Dim mySC As SeriesCollection = getRandomData()
' Modify each element so that YValueStart - YValue = 0. For Each el As Element In mySC(0).Elements Dim val As Double = el.YValue el.YValue = val / 2 el.YValueStart = -el.YValue Next el
' Add the random data. Chart.SeriesCollection.Add(mySC) End Sub
Function getRandomData() As SeriesCollection Dim myR As Random = New Random(1) Dim SC As SeriesCollection = New SeriesCollection() For a As Integer = 1 To 1 Dim s As Series = New Series("Series " & a.ToString()) For b As Integer = 1 To 4 Dim e As Element = New Element("Element " & b.ToString()) e.YValue = myR.Next(50) s.Elements.Add(e) Next b SC.Add(s) Next a Return SC End Function
Function getLiveData() As SeriesCollection Dim de As DataEngine = New DataEngine(ConfigurationManager.AppSettings("DNCConnectionString")) de.ChartObject = Chart ' Necessary to view any errors the dataEngine may throw. de.SqlStatement = "SELECT XAxisColumn, YAxisColumn FROM ...." Return de.GetSeries() End Function