Org Groups 2
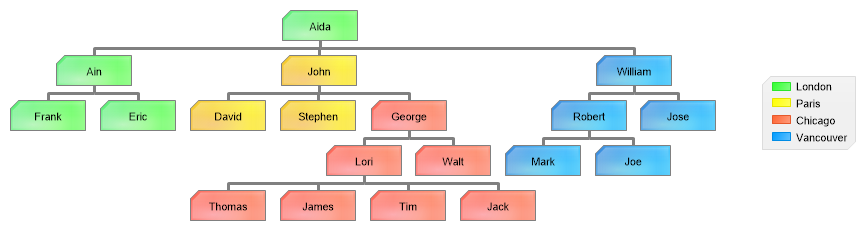
Demonstrates color coding organizational nodes from a database based on the location.
<%@ Page Language="C#" Description="dotnetCHARTING Component" %>
<%@ Register TagPrefix="dnc" Namespace="dotnetCHARTING" Assembly="dotnetCHARTING" %>
<%@ Import Namespace="System.Drawing" %>
<%@ Import Namespace="System.Drawing.Drawing2D" %>
<%@ Import Namespace="dotnetCHARTING.Mapping" %>
<script runat="server">
void Page_Load(Object sender, EventArgs e)
{
// Demonstrates color coding organizational nodes from a database based on the location.
Chart.Size = "900x300";
Chart.TempDirectory = "temp";
Chart.Type = ChartType.Organizational;
Chart.Debug = true;
Chart.Palette = new Color[] { Color.FromArgb(49, 255, 49), Color.FromArgb(255, 255, 0), Color.FromArgb(255, 99, 49), Color.FromArgb(0, 156, 255), Color.Orange };
Chart.LegendBox.Background.Color = Color.FromArgb(240, 240, 240);
// Set styling defaults.
Chart.ChartArea.ClearColors();
Chart.DefaultSeries.Line.Color = Color.Gray;
Chart.DefaultSeries.Line.Width = 3;
// Style the default annotation.
Chart.DefaultElement.Annotation = new Annotation();
Chart.DefaultElement.Annotation.Padding = 5;
Chart.DefaultElement.Annotation.Size = new Size(75, 30);
Chart.DefaultElement.Annotation.Background.ShadingEffectMode = ShadingEffectMode.Background2;
// Trim the data to get organizational levels and other attributes.
SeriesCollection mySC = getLiveData().Trim(20);
int i = 0;
foreach (Series s in mySC)
{
foreach (Element el in s.Elements)
{
if (el.Annotation == null) el.Annotation = new Annotation();
el.Annotation.Background.Color = Chart.Palette[i];
}
i++;
}
// Set some legend properties.
Chart.LegendBox.DefaultEntry.Value = "";
Chart.LegendBox.Visible = true;
Chart.LegendBox.Position = LegendBoxPosition.Middle;
Chart.LegendBox.Padding = 5;
// Add the data
Chart.SeriesCollection.Add(mySC);
}
SeriesCollection getLiveData()
{
// Obtain series data from the database. Note this was created by adding PID (parentid)
// to an existing table only, then populating the parentid based on the hiearchy in place.
DataEngine de = new DataEngine(ConfigurationManager.AppSettings["DNCConnectionString"]);
de.SqlStatement = @"SELECT * FROM Employees";
de.DataFields = "InstanceID=ID,InstanceParentID=PID,Name=Name,splitby=Location,office,Department,Email,Phone,Picture,Location";
de.ChartType = ChartType.Organizational;
return de.GetSeries();
}
</script>
<html xmlns="http://www.w3.org/1999/xhtml">
<head>
<title>.netCHARTING Sample</title>
</head>
<body>
<div align="center">
<dnc:Chart ID="Chart" runat="server" />
</div>
</body>
</html>
<%@ Page Language="vb" Description="dotnetCHARTING Component" %>
<%@ Register TagPrefix="dnc" Namespace="dotnetCHARTING" Assembly="dotnetCHARTING" %>
<%@ Import Namespace="System.Drawing" %>
<%@ Import Namespace="System.Drawing.Drawing2D" %>
<%@ Import Namespace="dotnetCHARTING.Mapping" %>
<script runat="server">
Sub Page_Load(ByVal sender As Object, ByVal e As EventArgs)
' Demonstrates color coding organizational nodes from a database based on the location.
Chart.Size = "900x300"
Chart.TempDirectory = "temp"
Chart.Type = ChartType.Organizational
Chart.Debug = True
Chart.Palette = New Color() { Color.FromArgb(49, 255, 49), Color.FromArgb(255, 255, 0), Color.FromArgb(255, 99, 49), Color.FromArgb(0, 156, 255), Color.Orange }
Chart.LegendBox.Background.Color = Color.FromArgb(240, 240, 240)
' Set styling defaults.
Chart.ChartArea.ClearColors()
Chart.DefaultSeries.Line.Color = Color.Gray
Chart.DefaultSeries.Line.Width = 3
' Style the default annotation.
Chart.DefaultElement.Annotation = New Annotation()
Chart.DefaultElement.Annotation.Padding = 5
Chart.DefaultElement.Annotation.Size = New Size(75, 30)
Chart.DefaultElement.Annotation.Background.ShadingEffectMode = ShadingEffectMode.Background2
' Trim the data to get organizational levels and other attributes.
Dim mySC As SeriesCollection = getLiveData().Trim(20)
Dim i As Integer = 0
For Each s As Series In mySC
For Each el As Element In s.Elements
If el.Annotation Is Nothing Then
el.Annotation = New Annotation()
End If
el.Annotation.Background.Color = Chart.Palette(i)
Next el
i += 1
Next s
' Set some legend properties.
Chart.LegendBox.DefaultEntry.Value = ""
Chart.LegendBox.Visible = True
Chart.LegendBox.Position = LegendBoxPosition.Middle
Chart.LegendBox.Padding = 5
' Add the data
Chart.SeriesCollection.Add(mySC)
End Sub
Function getLiveData() As SeriesCollection
' Obtain series data from the database. Note this was created by adding PID (parentid)
' to an existing table only, then populating the parentid based on the hiearchy in place.
Dim de As DataEngine = New DataEngine(ConfigurationManager.AppSettings("DNCConnectionString"))
de.SqlStatement = "SELECT * FROM Employees"
de.DataFields = "InstanceID=ID,InstanceParentID=PID,Name=Name,splitby=Location,office,Department,Email,Phone,Picture,Location"
de.ChartType = ChartType.Organizational
Return de.GetSeries()
End Function
</script>
<html xmlns="http://www.w3.org/1999/xhtml">
<head>
<title>.netCHARTING Sample</title>
</head>
<body>
<div align="center">
<dnc:Chart ID="Chart" runat="server" />
</div>
</body>
</html>