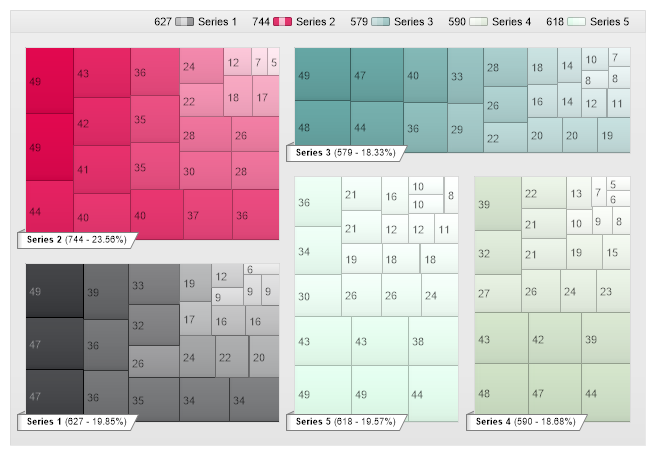
Gallery
Tree Map Ribbon
<%@ Page Language="C#" Description="dotnetCHARTING Component" %>
<%@ Register TagPrefix="dnc" Namespace="dotnetCHARTING" Assembly="dotnetCHARTING" %>
<%@ Import Namespace="System.Drawing" %>
<script runat="server">
void Page_Load(Object sender, EventArgs e)
{
// Demonstrates a TreeMap chart where each series uses a different color range to color encode the element values.
Chart.Size = "650x450";
Chart.TempDirectory = "temp";
Chart.Debug = true;
Chart.Type = ChartType.TreeMap;
//Chart.ShadingEffectMode = ShadingEffectMode.One;
Chart.PaletteName = Palette.FiveColor3;
Chart.ChartArea.Line.Color= Color.FromArgb(125, Color.LightGray);
Chart.ChartArea.Background.Color = Color.FromArgb(125, Color.LightGray);
//Chart.ChartArea.Background.ShadingEffectMode = ShadingEffectMode.Background1;
Chart.TitleBox.Background.Color =Color.FromArgb(105, Color.LightGray);
//Chart.TitleBox.Background.ShadingEffectMode = ShadingEffectMode.Background1;
Chart.TitleBox.Position = TitleBoxPosition.FullWithLegend;
Chart.TitleBox.DefaultCorner = BoxCorner.Square;
// Distance between series boxes
Chart.ChartArea.Padding = 15;
// Specify a header for each series box.
Chart.DefaultSeries.Box.Header.Label.Text = "<block fStyle='bold'>%Name <block>(%YSum - %PercentOfTotal)";
Chart.DefaultSeries.Box.Header.Label.Font = new Font("Arial", 7);
Chart.DefaultSeries.Box.Header.Label.Alignment = StringAlignment.Near;
Chart.DefaultSeries.Box.Header.StartAlignment = EdgeAlignment.Edge;
Chart.DefaultSeries.Box.Header.EndAlignment = EdgeAlignment.Inside;
Chart.DefaultSeries.Box.Header.StartCap = BoxCapStyle.RibbonUp;
Chart.DefaultSeries.Box.Header.EndCap = BoxCapStyle.CutUp;
Chart.DefaultSeries.Box.Header.Orientation = dotnetCHARTING.Orientation.Bottom;
// Chart.DefaultSeries.Box.Header.Offset = new Point(0, 5);
Chart.DefaultSeries.Box.Header.VerticalAlignment = EdgeAlignment.Edge;
Chart.DefaultSeries.Box.Padding = 1;
//Element labels and tooltip
Chart.DefaultElement.ToolTip = "%Name";
Chart.DefaultElement.ShowValue = true;
Chart.DefaultElement.SmartLabel.DynamicDisplay = false;
Chart.DefaultElement.SmartLabel.LineAlignment = StringAlignment.Center;
// *DYNAMIC DATA NOTE*
// This sample uses random data to populate the chart. To populate
// a chart with database data see the following resources:
// - Use the getLiveData() method using the dataEngine to query a database.
// - Help File > Getting Started > Data Tutorials
// - DataEngine Class in the help file
// - Sample: features/DataEngine.aspx
SeriesCollection mySC = getRandomData();
// Add the random data.
Chart.SeriesCollection.Add(mySC);
// Color Ranges: This loop adds a color range for each series ranges from white to the series color and depending on the element value.
for (int i = 0; i < Chart.SeriesCollection.Count; i++)
{
AddSeriesColor( Chart.SeriesCollection[i].Name, Chart.Palette[i]);
}
}
void AddSeriesColor(string sName, Color c)
{
SmartColor sc = new SmartColor(Color.White,c, new ScaleRange(0, 50));
sc.LegendEntry.Visible = false;
Chart.SmartPalette.Add(sName, sc);
}
SeriesCollection getRandomData()
{
Random myR = new Random(1);
SeriesCollection SC = new SeriesCollection();
for (int a = 1; a < 6; a++)
{
Series s = new Series("Series " + a.ToString());
for (int b = 1; b < 25; b++)
{
Element e = new Element("Element " + b.ToString());
e.YValue = 5+myR.Next(45);
s.Elements.Add(e);
}
SC.Add(s);
}
return SC;
}
SeriesCollection getLiveData()
{
DataEngine de = new DataEngine(ConfigurationManager.AppSettings["DNCConnectionString"]);
de.ChartObject = Chart; // Necessary to view any errors the dataEngine may throw.
de.SqlStatement = "SELECT XAxisColumn, YAxisColumn FROM ....";
return de.GetSeries();
}
</script>
<html xmlns="http://www.w3.org/1999/xhtml">
<head>
<title>.netCHARTING Sample</title>
</head>
<body>
<div align="center">
<dnc:Chart ID="Chart" runat="server" />
</div>
</body>
</html>
<%@ Page Language="vb" Description="dotnetCHARTING Component" %>
<%@ Register TagPrefix="dnc" Namespace="dotnetCHARTING" Assembly="dotnetCHARTING" %>
<%@ Import Namespace="System.Drawing" %>
<script runat="server">
Sub Page_Load(ByVal sender As Object, ByVal e As EventArgs)
' Demonstrates a TreeMap chart where each series uses a different color range to color encode the element values.
Chart.Size = "650x450"
Chart.TempDirectory = "temp"
Chart.Debug = True
Chart.Type = ChartType.TreeMap
'Chart.ShadingEffectMode = ShadingEffectMode.One;
Chart.PaletteName = Palette.FiveColor3
Chart.ChartArea.Line.Color= Color.FromArgb(125, Color.LightGray)
Chart.ChartArea.Background.Color = Color.FromArgb(125, Color.LightGray)
'Chart.ChartArea.Background.ShadingEffectMode = ShadingEffectMode.Background1;
Chart.TitleBox.Background.Color =Color.FromArgb(105, Color.LightGray)
'Chart.TitleBox.Background.ShadingEffectMode = ShadingEffectMode.Background1;
Chart.TitleBox.Position = TitleBoxPosition.FullWithLegend
Chart.TitleBox.DefaultCorner = BoxCorner.Square
' Distance between series boxes
Chart.ChartArea.Padding = 15
' Specify a header for each series box.
Chart.DefaultSeries.Box.Header.Label.Text = "<block fStyle='bold'>%Name <block>(%YSum - %PercentOfTotal)"
Chart.DefaultSeries.Box.Header.Label.Font = New Font("Arial", 7)
Chart.DefaultSeries.Box.Header.Label.Alignment = StringAlignment.Near
Chart.DefaultSeries.Box.Header.StartAlignment = EdgeAlignment.Edge
Chart.DefaultSeries.Box.Header.EndAlignment = EdgeAlignment.Inside
Chart.DefaultSeries.Box.Header.StartCap = BoxCapStyle.RibbonUp
Chart.DefaultSeries.Box.Header.EndCap = BoxCapStyle.CutUp
Chart.DefaultSeries.Box.Header.Orientation = dotnetCHARTING.Orientation.Bottom
' Chart.DefaultSeries.Box.Header.Offset = new Point(0, 5);
Chart.DefaultSeries.Box.Header.VerticalAlignment = EdgeAlignment.Edge
Chart.DefaultSeries.Box.Padding = 1
'Element labels and tooltip
Chart.DefaultElement.ToolTip = "%Name"
Chart.DefaultElement.ShowValue = True
Chart.DefaultElement.SmartLabel.DynamicDisplay = False
Chart.DefaultElement.SmartLabel.LineAlignment = StringAlignment.Center
' *DYNAMIC DATA NOTE*
' This sample uses random data to populate the chart. To populate
' a chart with database data see the following resources:
' - Use the getLiveData() method using the dataEngine to query a database.
' - Help File > Getting Started > Data Tutorials
' - DataEngine Class in the help file
' - Sample: features/DataEngine.aspx
Dim mySC As SeriesCollection = getRandomData()
' Add the random data.
Chart.SeriesCollection.Add(mySC)
' Color Ranges: This loop adds a color range for each series ranges from white to the series color and depending on the element value.
For i As Integer = 0 To Chart.SeriesCollection.Count - 1
AddSeriesColor(Chart.SeriesCollection(i).Name, Chart.Palette(i))
Next i
End Sub
Sub AddSeriesColor(ByVal sName As String, ByVal c As Color)
Dim sc As SmartColor = New SmartColor(Color.White,c, New ScaleRange(0, 50))
sc.LegendEntry.Visible = False
Chart.SmartPalette.Add(sName, sc)
End Sub
Function getRandomData() As SeriesCollection
Dim myR As Random = New Random(1)
Dim SC As SeriesCollection = New SeriesCollection()
For a As Integer = 1 To 5
Dim s As Series = New Series("Series " & a.ToString())
For b As Integer = 1 To 24
Dim e As Element = New Element("Element " & b.ToString())
e.YValue = 5+myR.Next(45)
s.Elements.Add(e)
Next b
SC.Add(s)
Next a
Return SC
End Function
Function getLiveData() As SeriesCollection
Dim de As DataEngine = New DataEngine(ConfigurationManager.AppSettings("DNCConnectionString"))
de.ChartObject = Chart ' Necessary to view any errors the dataEngine may throw.
de.SqlStatement = "SELECT XAxisColumn, YAxisColumn FROM ...."
Return de.GetSeries()
End Function
</script>
<html xmlns="http://www.w3.org/1999/xhtml">
<head>
<title>.netCHARTING Sample</title>
</head>
<body>
<div align="center">
<dnc:Chart ID="Chart" runat="server" />
</div>
</body>
</html>
- Sample FilenameTreeMapRibbon.aspx
- Version6.2
- Uses DatabaseNo