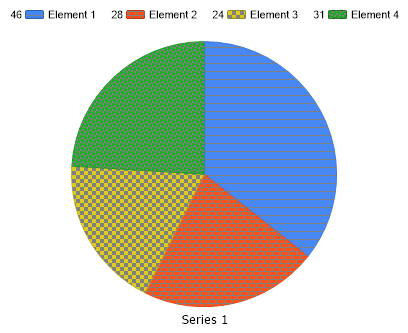
Gallery
Color Blind Pie
<%@ Page Language="C#" Description="dotnetCHARTING Component" %>
<%@ Register TagPrefix="dotnet" Namespace="dotnetCHARTING" Assembly="dotnetCHARTING" %>
<%@ Import Namespace="System.Drawing" %>
<html xmlns="http://www.w3.org/1999/xhtml">
<head>
<title>Color Blind Pie</title>
<script runat="server">
void Page_Load(Object sender, EventArgs e)
{
Chart.Type = ChartType.Pies;//Horizontal;
Chart.Width = 600;
Chart.Height = 350;
Chart.TempDirectory = "temp";
Chart.LegendBox.Orientation = dotnetCHARTING.Orientation.Top;
Chart.DefaultElement.HatchColor = Color.Gray;
// First we get our data, if you would like to get the data from a database you need to use
// the data engine. See sample: features/dataEngine.aspx. Or the dataEngine tutorial in the help file.
SeriesCollection sc = getRandomData();
sc[0].HatchStylePaletteName = HatchStylePalette.Two;
// Add the random data.
Chart.SeriesCollection.Add(sc);
}
SeriesCollection getRandomData()
{
SeriesCollection SC = new SeriesCollection();
Random myR = new Random();
for (int a = 1; a < 2; a++)
{
Series s = new Series();
s.Name = "Series " + a;
for (int b = 1; b < 5; b++)
{
Element e = new Element();
e.Name = "Element " + b;
//e.YValue = -25 + myR.Next(50);
e.YValue = myR.Next(50);
s.Elements.Add(e);
}
SC.Add(s);
}
return SC;
}
</script>
</head>
<body>
<div style="text-align: center">
<dotnet:Chart ID="Chart" runat="server" Width="568px" Height="344px">
</dotnet:Chart>
</div>
</body>
</html>
<%@ Page Language="vb" Description="dotnetCHARTING Component" %>
<%@ Register TagPrefix="dotnet" Namespace="dotnetCHARTING" Assembly="dotnetCHARTING" %>
<%@ Import Namespace="System.Drawing" %>
<html xmlns="http://www.w3.org/1999/xhtml">
<head>
<title>Color Blind Pie</title>
<script runat="server">
Sub Page_Load(ByVal sender As Object, ByVal e As EventArgs)
Chart.Type = ChartType.Pies 'Horizontal;
Chart.Width = 600
Chart.Height = 350
Chart.TempDirectory = "temp"
Chart.LegendBox.Orientation = dotnetCHARTING.Orientation.Top
Chart.DefaultElement.HatchColor = Color.Gray
' First we get our data, if you would like to get the data from a database you need to use
' the data engine. See sample: features/dataEngine.aspx. Or the dataEngine tutorial in the help file.
Dim sc As SeriesCollection = getRandomData()
sc(0).HatchStylePaletteName = HatchStylePalette.Two
' Add the random data.
Chart.SeriesCollection.Add(sc)
End Sub
Function getRandomData() As SeriesCollection
Dim SC As SeriesCollection = New SeriesCollection()
Dim myR As Random = New Random()
For a As Integer = 1 To 1
Dim s As Series = New Series()
s.Name = "Series " & a
For b As Integer = 1 To 4
Dim e As Element = New Element()
e.Name = "Element " & b
'e.YValue = -25 + myR.Next(50);
e.YValue = myR.Next(50)
s.Elements.Add(e)
Next b
SC.Add(s)
Next a
Return SC
End Function
</script>
</head>
<body>
<div style="text-align: center">
<dotnet:Chart ID="Chart" runat="server" Width="568px" Height="344px">
</dotnet:Chart>
</div>
</body>
</html>
- Sample FilenameColorBlindPie.aspx
- VersionLegacy (Pre 3.0)
- Uses DatabaseNo