Org Complex
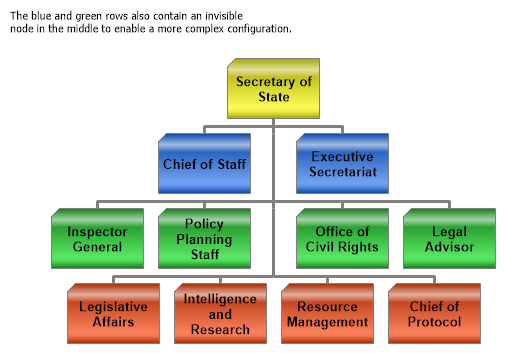
Demonstrates setting up an organizational chart with invisible nodes.
<%@ Page Language="C#" Description="dotnetCHARTING Component" %>
<%@ Register TagPrefix="dotnet" Namespace="dotnetCHARTING" Assembly="dotnetCHARTING" %>
<%@ Import Namespace="System.Drawing" %>
<script runat="server">
void Page_Load(Object sender, EventArgs e)
{
// Demonstrates setting up an organizational chart with invisible nodes.
Chart.TempDirectory = "temp";
Chart.Debug = true;
Chart.Type = ChartType.Organizational;
Chart.Size = "550x400";
Chart.ChartArea.Label.Text = "The blue and green rows also contain an invisible \nnode in the middle to enable a more complex configuration.";
Chart.DefaultSeries.Line.Color = Color.Gray;
Chart.DefaultSeries.Line.Width = 3;
Chart.DefaultElement.Annotation = new Annotation();
Chart.DefaultElement.Annotation.Padding = 5;
Chart.DefaultElement.Annotation.Background.ShadingEffectMode = ShadingEffectMode.Three;
Chart.DefaultElement.Annotation.Label.Font = new Font("Arial", 10, FontStyle.Bold);
Chart.DefaultElement.Annotation.Size = new Size(92, 60);
Chart.DefaultElement.Annotation.Background.Color = Color.Yellow;
// *DYNAMIC DATA NOTE*
// This sample uses random data to populate the chart. To populate
// a chart with database data see the following resources:
// - Use the getLiveData() method using the dataEngine to query a database.
// - Help File > Getting Started > Data Tutorials
// - DataEngine Class in the help file
// - Sample: features/DataEngine.aspx
Chart.SeriesCollection.Add(getData());
}
SeriesCollection getData()
{
Element p1 = new Element("Secretary of State");
Element vp1 = new Element("Chief of Staff");
Element vpE = new Element("");
Element vp3 = new Element("Executive Secretariat");
Element mm1 = new Element("Inspector General");
Element mm2 = new Element("Policy Planning Staff");
Element mm3 = new Element("Office of Civil Rights");
Element mm4 = new Element("Legal Advisor");
Element mm5 = new Element("Legislative Affairs");
Element mm6 = new Element("Intelligence and Research");
Element mm7 = new Element("Resource Management");
Element mm8 = new Element("Chief of Protocol");
Element mmE = new Element("");
mmE.Parent = vpE;
vp1.Parent = p1;
vpE.Parent = p1;
vp3.Parent = p1;
mm1.Parent = vpE;
mm2.Parent = vpE;
mm3.Parent = vpE;
mm4.Parent = vpE;
mm5.Parent = mmE;
mm6.Parent = mmE;
mm7.Parent = mmE;
mm8.Parent = mmE;
Color [] palette = ChartPalettes.GetPalette(Palette.Default);
Series Depts2 = new Series("Low Level", mm5, mm6, mm7, mm8);
Series Depts1 = new Series("Deparment Head", mm1, mm2, mmE, mm3, mm4);
Series vpS = new Series("Top Leaders", vp1, vpE, vp3);
Series President = new Series("", p1);
Depts1.DefaultElement.Annotation = new Annotation();
Depts1.DefaultElement.Annotation.Background.Color = palette[3];
Depts2.DefaultElement.Annotation = new Annotation();
Depts2.DefaultElement.Annotation.Background.Color = palette[1];
vpS.DefaultElement.Annotation = new Annotation();
vpS.DefaultElement.Annotation.Background.Color = palette[0];
SeriesCollection scSolo = new SeriesCollection(President, vpS, Depts1, Depts2);
return scSolo;
}
</script>
<html xmlns="http://www.w3.org/1999/xhtml">
<head>
<title>.netCHARTING Sample</title>
</head>
<body>
<div align="center">
<dotnet:Chart ID="Chart" runat="server" />
</div>
</body>
</html>
<%@ Page Language="vb" Description="dotnetCHARTING Component" %>
<%@ Register TagPrefix="dotnet" Namespace="dotnetCHARTING" Assembly="dotnetCHARTING" %>
<%@ Import Namespace="System.Drawing" %>
<script runat="server">
Sub Page_Load(ByVal sender As Object, ByVal e As EventArgs)
' Demonstrates setting up an organizational chart with invisible nodes.
Chart.TempDirectory = "temp"
Chart.Debug = True
Chart.Type = ChartType.Organizational
Chart.Size = "550x400"
Chart.ChartArea.Label.Text = "The blue and green rows also contain an invisible " & Constants.vbLf & "node in the middle to enable a more complex configuration."
Chart.DefaultSeries.Line.Color = Color.Gray
Chart.DefaultSeries.Line.Width = 3
Chart.DefaultElement.Annotation = New Annotation()
Chart.DefaultElement.Annotation.Padding = 5
Chart.DefaultElement.Annotation.Background.ShadingEffectMode = ShadingEffectMode.Three
Chart.DefaultElement.Annotation.Label.Font = New Font("Arial", 10, FontStyle.Bold)
Chart.DefaultElement.Annotation.Size = New Size(92, 60)
Chart.DefaultElement.Annotation.Background.Color = Color.Yellow
' *DYNAMIC DATA NOTE*
' This sample uses random data to populate the chart. To populate
' a chart with database data see the following resources:
' - Use the getLiveData() method using the dataEngine to query a database.
' - Help File > Getting Started > Data Tutorials
' - DataEngine Class in the help file
' - Sample: features/DataEngine.aspx
Chart.SeriesCollection.Add(getData())
End Sub
Function getData() As SeriesCollection
Dim p1 As Element = New Element("Secretary of State")
Dim vp1 As Element = New Element("Chief of Staff")
Dim vpE As Element = New Element("")
Dim vp3 As Element = New Element("Executive Secretariat")
Dim mm1 As Element = New Element("Inspector General")
Dim mm2 As Element = New Element("Policy Planning Staff")
Dim mm3 As Element = New Element("Office of Civil Rights")
Dim mm4 As Element = New Element("Legal Advisor")
Dim mm5 As Element = New Element("Legislative Affairs")
Dim mm6 As Element = New Element("Intelligence and Research")
Dim mm7 As Element = New Element("Resource Management")
Dim mm8 As Element = New Element("Chief of Protocol")
Dim mmE As Element = New Element("")
mmE.Parent = vpE
vp1.Parent = p1
vpE.Parent = p1
vp3.Parent = p1
mm1.Parent = vpE
mm2.Parent = vpE
mm3.Parent = vpE
mm4.Parent = vpE
mm5.Parent = mmE
mm6.Parent = mmE
mm7.Parent = mmE
mm8.Parent = mmE
Dim palette As Color() = ChartPalettes.GetPalette(dotnetCHARTING.Palette.Default)
Dim Depts2 As Series = New Series("Low Level", mm5, mm6, mm7, mm8)
Dim Depts1 As Series = New Series("Deparment Head", mm1, mm2, mmE, mm3, mm4)
Dim vpS As Series = New Series("Top Leaders", vp1, vpE, vp3)
Dim President As Series = New Series("", p1)
Depts1.DefaultElement.Annotation = New Annotation()
Depts1.DefaultElement.Annotation.Background.Color = palette(3)
Depts2.DefaultElement.Annotation = New Annotation()
Depts2.DefaultElement.Annotation.Background.Color = palette(1)
vpS.DefaultElement.Annotation = New Annotation()
vpS.DefaultElement.Annotation.Background.Color = palette(0)
Dim scSolo As SeriesCollection = New SeriesCollection(President, vpS, Depts1, Depts2)
Return scSolo
End Function
</script>
<html xmlns="http://www.w3.org/1999/xhtml">
<head>
<title>.netCHARTING Sample</title>
</head>
<body>
<div align="center">
<dotnet:Chart ID="Chart" runat="server" />
</div>
</body>
</html>