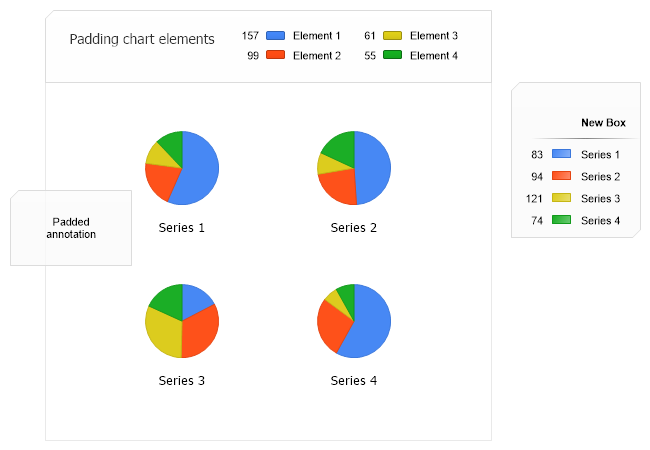
Chart.Type = ChartType.Pies;//Horizontal; Chart.Width = 700; Chart.Height = 550; Chart.TempDirectory = "temp"; Chart.Debug = true; Chart.Title = "Padding chart elements"; Chart.TitleBox.Background.Color = Color.FromArgb(10, 240, 240, 240); Chart.LegendBox.Background.Color = Color.FromArgb(10, 240, 240, 240); Chart.ChartArea.Line.Color = Color.FromArgb(100, 200, 200, 200); // Demonstrates how to pad different parts of the chart.
// *DYNAMIC DATA NOTE* // This sample uses random data to populate the chart. To populate // a chart with database data see the following resources: // - Classic samples folder // - Help File > Data Tutorials // - Sample: features/DataEngine.aspx SeriesCollection mySC = getRandomData();
// 1. PADDING THE CHART IMAGE Chart.Margin = "50";
// 2. PADDING THE TITLE BOX Chart.TitleBox.Position = TitleBoxPosition.FullWithLegend; Chart.TitleBox.Padding = 20;
// 3. PADDING LEGEND BOXES IN TITLES // This shows how padding of legendboxes works independently of the title boxes they are in. // If a chart area is new with the legend in title and doesnt have a legend box instantiated // you must do so before you can modify it's properties. Chart.LegendBox.Padding = 8;
// 4. PADDING LEGEND BOXES // We'll create another legend box to show the padding functionality LegendBox lb = new LegendBox(); lb.HeaderEntry.Visible = true; lb.HeaderEntry.Name = "New Box"; lb.HeaderEntry.Value = ""; lb.HeaderEntry.CustomAttributes = "Icon="; // Legend entries can also add padding at the top which is useful with when used as headers. lb.HeaderEntry.PaddingTop = 25; lb.Padding = 10; lb.DataSource = mySC; // Add the new legend box. Chart.ExtraLegendBoxes.Add(lb);
// 5. PADDING BETWEEN PIES AND LABELS // This works also with radar and gauge charts. Chart.XAxis.TickLabelPadding = 15;
// 6. PADDING OF CHART BOXES // This includes chart areas, legend boxes etc. Chart.ChartAreaSpacing = 20;
// 7. PADDING BETWEEN PIES // This works also with radar and gauge charts. Chart.ChartArea.Padding = 50;
// 8. PADDING ANNOTATIONS Annotation an = new Annotation("Padded \nannotation"); an.Position = new Point(15,250); // Specify the annotaiton padding. an.Padding = 25; // Add the annotation. Chart.Annotations.Add(an);
// NOTE: If you would like to control column width please see sample features/BarFixedSize.aspx
// Add the random data. Chart.SeriesCollection.Add(mySC);
}
SeriesCollection getRandomData() { SeriesCollection SC = new SeriesCollection(); Random myR = new Random(); for(int a = 1; a < 5; a++) { Series s = new Series(); s.Name = "Series " + a; for(int b = 1; b < 5; b++) { Element e = new Element(); e.Name = "Element " + b; //e.YValue = -25 + myR.Next(50); e.YValue = myR.Next(50); s.Elements.Add(e); } SC.Add(s); }
Sub Page_Load(ByVal sender As Object, ByVal e As EventArgs)
Chart.Type = ChartType.Pies 'Horizontal; Chart.Width = 700 Chart.Height = 550 Chart.TempDirectory = "temp" Chart.Debug = True Chart.Title = "Padding chart elements" Chart.TitleBox.Background.Color = Color.FromArgb(10, 240, 240, 240) Chart.LegendBox.Background.Color = Color.FromArgb(10, 240, 240, 240) Chart.ChartArea.Line.Color = Color.FromArgb(100, 200, 200, 200) ' Demonstrates how to pad different parts of the chart.
' *DYNAMIC DATA NOTE* ' This sample uses random data to populate the chart. To populate ' a chart with database data see the following resources: ' - Classic samples folder ' - Help File > Data Tutorials ' - Sample: features/DataEngine.aspx Dim mySC As SeriesCollection = getRandomData()
' 1. PADDING THE CHART IMAGE Chart.Margin = "50"
' 2. PADDING THE TITLE BOX Chart.TitleBox.Position = TitleBoxPosition.FullWithLegend Chart.TitleBox.Padding = 20
' 3. PADDING LEGEND BOXES IN TITLES ' This shows how padding of legendboxes works independently of the title boxes they are in. ' If a chart area is new with the legend in title and doesnt have a legend box instantiated ' you must do so before you can modify it's properties. Chart.LegendBox.Padding = 8
' 4. PADDING LEGEND BOXES ' We'll create another legend box to show the padding functionality Dim lb As LegendBox = New LegendBox() lb.HeaderEntry.Visible = True lb.HeaderEntry.Name = "New Box" lb.HeaderEntry.Value = "" lb.HeaderEntry.CustomAttributes = "Icon=" ' Legend entries can also add padding at the top which is useful with when used as headers. lb.HeaderEntry.PaddingTop = 25 lb.Padding = 10 lb.DataSource = mySC ' Add the new legend box. Chart.ExtraLegendBoxes.Add(lb)
' 5. PADDING BETWEEN PIES AND LABELS ' This works also with radar and gauge charts. Chart.XAxis.TickLabelPadding = 15
' 6. PADDING OF CHART BOXES ' This includes chart areas, legend boxes etc. Chart.ChartAreaSpacing = 20
' 7. PADDING BETWEEN PIES ' This works also with radar and gauge charts. Chart.ChartArea.Padding = 50
' 8. PADDING ANNOTATIONS Dim an As Annotation = New Annotation("Padded " & Constants.vbLf & "annotation") an.Position = New Point(15,250) ' Specify the annotaiton padding. an.Padding = 25 ' Add the annotation. Chart.Annotations.Add(an)
' NOTE: If you would like to control column width please see sample features/BarFixedSize.aspx
' Add the random data. Chart.SeriesCollection.Add(mySC)
End Sub
Function getRandomData() As SeriesCollection Dim SC As SeriesCollection = New SeriesCollection() Dim myR As Random = New Random() For a As Integer = 1 To 4 Dim s As Series = New Series() s.Name = "Series " & a For b As Integer = 1 To 4 Dim e As Element = New Element() e.Name = "Element " & b 'e.YValue = -25 + myR.Next(50); e.YValue = myR.Next(50) s.Elements.Add(e) Next b SC.Add(s) Next a
Return SC End Function </script> </head> <body> <div style="text-align:center"> <dotnet:Chart id="Chart" runat="server" Width="568px" Height="344px"> </dotnet:Chart> </div> </body> </html>