Gallery
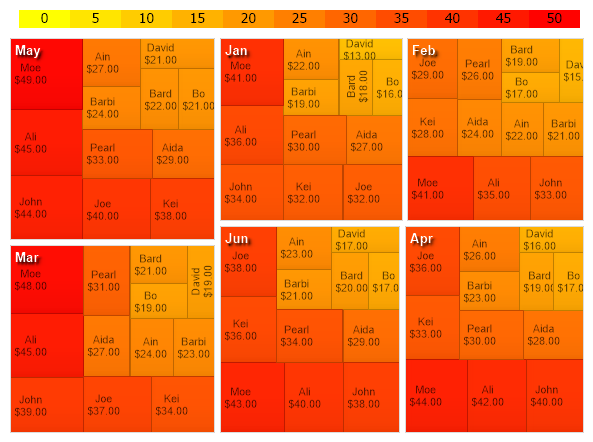
Tree Map DB
<%@ Page Language="C#" Description="dotnetCHARTING Component" %>
<%@ Register TagPrefix="dnc" Namespace="dotnetCHARTING" Assembly="dotnetCHARTING" %>
<%@ Import Namespace="System.Drawing" %>
<script runat="server">
void Page_Load(Object sender, EventArgs e)
{
// Demonstrates getting live treeMap data with multiple series.
Chart.Size = "600x450";
Chart.TempDirectory = "temp";
Chart.Debug = true;
Chart.Type = ChartType.TreeMap;
Chart.TitleBox.Position = TitleBoxPosition.FullWithLegend;
Chart.ShowDateInTitle = false;
Chart.LegendBox.Orientation = dotnetCHARTING.Orientation.None;
// Series Label control
Chart.DefaultSeries.Box.Label.Color = Color.White;
Chart.DefaultSeries.Box.Label.Shadow.Color = Color.Black;
Chart.DefaultSeries.Box.Label.Shadow.Depth = 3;
Chart.DefaultSeries.Box.Label.Alignment = StringAlignment.Near;
Chart.DefaultSeries.Box.Label.LineAlignment = StringAlignment.Near;
Chart.DefaultSeries.Box.Label.Text = "%Name";
Chart.DefaultSeries.Box.Label.Font = new Font("Arial", 10, FontStyle.Bold);
// Distance between series boxes
Chart.ChartArea.Padding = 6;
Chart.LegendBox.DefaultEntry.Visible = false;
//Element labels and tooltip
Chart.DefaultElement.ToolTip = "%Name";
Chart.DefaultElement.ShowValue = true;
Chart.DefaultElement.SmartLabel.Text = "%Name\n<%YValue,Currency>";
Chart.DefaultElement.SmartLabel.DynamicDisplay = false;
Chart.DefaultElement.SmartLabel.LineAlignment = StringAlignment.Center;
getLiveData();
// Setup Range SmartPalette
Chart.SmartPalette.Add("*", new SmartColor(Color.Yellow,Color.Red, new ScaleRange(0, 50)));
Chart.Title = getSwatch(480, Chart.SmartPalette, 10);
}
string getSwatch(int width, SmartPalette sp, int divisions)
{
string result = "";
string spacers = "";
int boxWidth = width / divisions;
double max = (double)sp.GetScaleRange("*").ValueHigh;
for (int i = 0; i <= divisions; i++)
{
spacers += "<Chart:Spacer size='" + boxWidth + "x1'>";
string color = getHTMLColor(sp.GetValueColor("", (i * (max / divisions))));
result += "<block hAlign='Center' bgColor='" + color + "' fColor='Black' fStyle='Regular' >" + (i * (max / divisions));
}
result = spacers + "<row>" + result;
return result;
}
string getHTMLColor(Color c)
{
return "#" + c.R.ToString("X2") + c.G.ToString("X2") + c.B.ToString("X2");
}
void getLiveData()
{
Chart.DefaultSeries.ConnectionString = ConfigurationManager.AppSettings["DNCConnectionString"];
//Add Jan series
Chart.Series.Name = "Jan";
Chart.Series.StartDate = new System.DateTime(2022, 1, 1, 0, 0, 0);
Chart.Series.EndDate = new System.DateTime(2022, 1, 31, 23, 59, 59);
Chart.Series.SqlStatement = @"SELECT Name, Sum(1) FROM Orders WHERE OrderDate >= #STARTDATE# AND OrderDate <= #ENDDATE# GROUP BY Name";
Chart.SeriesCollection.Add();
//Add Feb series
Chart.Series.Name = "Feb";
Chart.Series.StartDate = new System.DateTime(2022, 2, 1, 0, 0, 0);
Chart.Series.EndDate = new System.DateTime(2022, 2, 28, 23, 59, 59);
Chart.Series.SqlStatement = @"SELECT Name, Sum(1) FROM Orders WHERE OrderDate >= #STARTDATE# AND OrderDate <= #ENDDATE# GROUP BY Name";
Chart.SeriesCollection.Add();
//Add Mar series
Chart.Series.Name = "Mar";
Chart.Series.StartDate = new System.DateTime(2022, 3, 1, 0, 0, 0);
Chart.Series.EndDate = new System.DateTime(2022, 3, 31, 23, 59, 59);
Chart.Series.SqlStatement = @"SELECT Name, Sum(1) FROM Orders WHERE OrderDate >= #STARTDATE# AND OrderDate <= #ENDDATE# GROUP BY Name";
Chart.SeriesCollection.Add();
//Add Apr series
Chart.Series.Name = "Apr";
Chart.Series.StartDate = new System.DateTime(2022, 4, 1, 0, 0, 0);
Chart.Series.EndDate = new System.DateTime(2022, 4, 30, 23, 59, 59);
Chart.Series.SqlStatement = @"SELECT Name, Sum(1) FROM Orders WHERE OrderDate >= #STARTDATE# AND OrderDate <= #ENDDATE# GROUP BY Name";
Chart.SeriesCollection.Add();
//Add May series
Chart.Series.Name = "May";
Chart.Series.StartDate = new System.DateTime(2022, 5, 1, 0, 0, 0);
Chart.Series.EndDate = new System.DateTime(2022, 5, 31, 23, 59, 59);
Chart.Series.SqlStatement = @"SELECT Name, Sum(1) FROM Orders WHERE OrderDate >= #STARTDATE# AND OrderDate <= #ENDDATE# GROUP BY Name";
Chart.SeriesCollection.Add();
//Add June series
Chart.Series.Name = "Jun";
Chart.Series.StartDate = new System.DateTime(2022, 6, 1, 0, 0, 0);
Chart.Series.EndDate = new System.DateTime(2022, 6, 30, 23, 59, 59);
Chart.Series.SqlStatement = @"SELECT Name, Sum(1) FROM Orders WHERE OrderDate >= #STARTDATE# AND OrderDate <= #ENDDATE# GROUP BY Name";
Chart.SeriesCollection.Add();
}
</script>
<html xmlns="http://www.w3.org/1999/xhtml">
<head>
<title>.netCHARTING Sample</title>
</head>
<body>
<div align="center">
<dnc:Chart ID="Chart" runat="server" />
</div>
</body>
</html>
<%@ Page Language="vb" Description="dotnetCHARTING Component" %>
<%@ Register TagPrefix="dnc" Namespace="dotnetCHARTING" Assembly="dotnetCHARTING" %>
<%@ Import Namespace="System.Drawing" %>
<script runat="server">
Sub Page_Load(ByVal sender As Object, ByVal e As EventArgs)
' Demonstrates getting live treeMap data with multiple series.
Chart.Size = "600x450"
Chart.TempDirectory = "temp"
Chart.Debug = True
Chart.Type = ChartType.TreeMap
Chart.TitleBox.Position = TitleBoxPosition.FullWithLegend
Chart.ShowDateInTitle = False
Chart.LegendBox.Orientation = dotnetCHARTING.Orientation.None
' Series Label control
Chart.DefaultSeries.Box.Label.Color = Color.White
Chart.DefaultSeries.Box.Label.Shadow.Color = Color.Black
Chart.DefaultSeries.Box.Label.Shadow.Depth = 3
Chart.DefaultSeries.Box.Label.Alignment = StringAlignment.Near
Chart.DefaultSeries.Box.Label.LineAlignment = StringAlignment.Near
Chart.DefaultSeries.Box.Label.Text = "%Name"
Chart.DefaultSeries.Box.Label.Font = New Font("Arial", 10, FontStyle.Bold)
' Distance between series boxes
Chart.ChartArea.Padding = 6
Chart.LegendBox.DefaultEntry.Visible = False
'Element labels and tooltip
Chart.DefaultElement.ToolTip = "%Name"
Chart.DefaultElement.ShowValue = True
Chart.DefaultElement.SmartLabel.Text = "%Name" & Constants.vbLf & "<%YValue,Currency>"
Chart.DefaultElement.SmartLabel.DynamicDisplay = False
Chart.DefaultElement.SmartLabel.LineAlignment = StringAlignment.Center
getLiveData()
' Setup Range SmartPalette
Chart.SmartPalette.Add("*", New SmartColor(Color.Yellow,Color.Red, New ScaleRange(0, 50)))
Chart.Title = getSwatch(480, Chart.SmartPalette, 10)
End Sub
Function getSwatch(ByVal width As Integer, ByVal sp As SmartPalette, ByVal divisions As Integer) As String
Dim result As String = ""
Dim spacers As String = ""
Dim boxWidth As Integer = width / divisions
Dim max As Double = CDbl(sp.GetScaleRange("*").ValueHigh)
For i As Integer = 0 To divisions
spacers &= "<Chart:Spacer size='" & boxWidth & "x1'>"
Dim color As String = getHTMLColor(sp.GetValueColor("", (i * (max / divisions))))
result &= "<block hAlign='Center' bgColor='" & color & "' fColor='Black' fStyle='Regular' >" & (i * (max / divisions))
Next i
result = spacers & "<row>" & result
Return result
End Function
Function getHTMLColor(ByVal c As Color) As String
Return "#" & c.R.ToString("X2") + c.G.ToString("X2") + c.B.ToString("X2")
End Function
Sub getLiveData()
Chart.DefaultSeries.ConnectionString = ConfigurationManager.AppSettings("DNCConnectionString")
'Add Jan series
Chart.Series.Name = "Jan"
Chart.Series.StartDate = New System.DateTime(2022, 1, 1, 0, 0, 0)
Chart.Series.EndDate = New System.DateTime(2022, 1, 31, 23, 59, 59)
Chart.Series.SqlStatement = "SELECT Name, Sum(1) FROM Orders WHERE OrderDate >= #STARTDATE# AND OrderDate <= #ENDDATE# GROUP BY Name"
Chart.SeriesCollection.Add()
'Add Feb series
Chart.Series.Name = "Feb"
Chart.Series.StartDate = New System.DateTime(2022, 2, 1, 0, 0, 0)
Chart.Series.EndDate = New System.DateTime(2022, 2, 28, 23, 59, 59)
Chart.Series.SqlStatement = "SELECT Name, Sum(1) FROM Orders WHERE OrderDate >= #STARTDATE# AND OrderDate <= #ENDDATE# GROUP BY Name"
Chart.SeriesCollection.Add()
'Add Mar series
Chart.Series.Name = "Mar"
Chart.Series.StartDate = New System.DateTime(2022, 3, 1, 0, 0, 0)
Chart.Series.EndDate = New System.DateTime(2022, 3, 31, 23, 59, 59)
Chart.Series.SqlStatement = "SELECT Name, Sum(1) FROM Orders WHERE OrderDate >= #STARTDATE# AND OrderDate <= #ENDDATE# GROUP BY Name"
Chart.SeriesCollection.Add()
'Add Apr series
Chart.Series.Name = "Apr"
Chart.Series.StartDate = New System.DateTime(2022, 4, 1, 0, 0, 0)
Chart.Series.EndDate = New System.DateTime(2022, 4, 30, 23, 59, 59)
Chart.Series.SqlStatement = "SELECT Name, Sum(1) FROM Orders WHERE OrderDate >= #STARTDATE# AND OrderDate <= #ENDDATE# GROUP BY Name"
Chart.SeriesCollection.Add()
'Add May series
Chart.Series.Name = "May"
Chart.Series.StartDate = New System.DateTime(2022, 5, 1, 0, 0, 0)
Chart.Series.EndDate = New System.DateTime(2022, 5, 31, 23, 59, 59)
Chart.Series.SqlStatement = "SELECT Name, Sum(1) FROM Orders WHERE OrderDate >= #STARTDATE# AND OrderDate <= #ENDDATE# GROUP BY Name"
Chart.SeriesCollection.Add()
'Add June series
Chart.Series.Name = "Jun"
Chart.Series.StartDate = New System.DateTime(2022, 6, 1, 0, 0, 0)
Chart.Series.EndDate = New System.DateTime(2022, 6, 30, 23, 59, 59)
Chart.Series.SqlStatement = "SELECT Name, Sum(1) FROM Orders WHERE OrderDate >= #STARTDATE# AND OrderDate <= #ENDDATE# GROUP BY Name"
Chart.SeriesCollection.Add()
End Sub
</script>
<html xmlns="http://www.w3.org/1999/xhtml">
<head>
<title>.netCHARTING Sample</title>
</head>
<body>
<div align="center">
<dnc:Chart ID="Chart" runat="server" />
</div>
</body>
</html>
- Sample FilenameTreeMapDB.aspx
- Version6.1
- Uses DatabaseYes