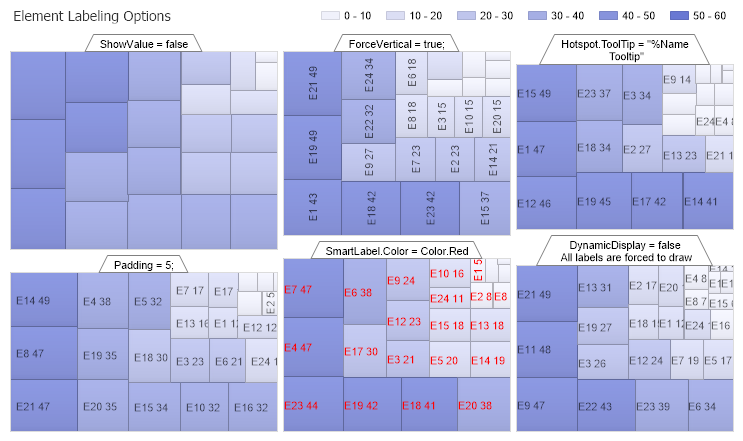
Tree Map Element Labeling
Demonstrates using a single smart palette for all series and indivisual element label options.
<%@ Page Language="C#" Description="dotnetCHARTING Component" %>
<%@ Register TagPrefix="dnc" Namespace="dotnetCHARTING" Assembly="dotnetCHARTING" %>
<%@ Import Namespace="System.Drawing" %>
<%@ Import Namespace="System.Drawing.Drawing2D" %>
<%@ Import Namespace="dotnetCHARTING.Mapping" %>
<script runat="server">
void Page_Load(Object sender, EventArgs e)
{
// Demonstrates using a single smart palette for all series and indivisual element label options.
Chart.Size = "750x450";
Chart.Title = "Element Labeling Options";
Chart.TempDirectory = "temp";
Chart.Debug = true;
Chart.Type = ChartType.TreeMap;
Chart.TitleBox.Position = TitleBoxPosition.FullWithLegend;
Chart.DefaultSeries.LegendEntry.Visible = false;
// Distance between series boxes
Chart.ChartArea.Padding = 6;
// Default Element label settings
Chart.DefaultElement.ShowValue = true;
Chart.DefaultElement.SmartLabel.Text = "%Name %YValue";
Chart.DefaultElement.SmartLabel.LineAlignment = StringAlignment.Center;
Chart.DefaultElement.SmartLabel.Padding = 0;
// Default series box settings.
Chart.DefaultSeries.Box.Header.VerticalAlignment = EdgeAlignment.Outside;
Chart.DefaultSeries.Box.Header.StartAlignment = EdgeAlignment.Inside;
Chart.DefaultSeries.Box.Header.StartCap = BoxCapStyle.CutDown;
Chart.DefaultSeries.Box.Header.EndAlignment = EdgeAlignment.Inside;
Chart.DefaultSeries.Box.Header.EndCap = BoxCapStyle.CutDown;
// *DYNAMIC DATA NOTE*
// This sample uses random data to populate the chart. To populate
// a chart with database data see the following resources:
// - Use the getLiveData() method using the dataEngine to query a database.
// - Help File > Getting Started > Data Tutorials
// - DataEngine Class in the help file
// - Sample: features/DataEngine.aspx
SeriesCollection mySC = getRandomData();
// Add the random data.
Chart.SeriesCollection.Add(mySC);
mySC[0].DefaultElement.SmartLabel.Padding = 5;
mySC[0].Box.HeaderLabel.Text = "Padding = 5;";
mySC[1].DefaultElement.ShowValue = false;
mySC[1].Box.HeaderLabel.Text = "ShowValue = false";
mySC[2].DefaultElement.SmartLabel.DynamicDisplay = false;
mySC[2].Box.HeaderLabel.Text = "DynamicDisplay = false\n All labels are forced to draw";
mySC[3].DefaultElement.SmartLabel.Color = Color.Red;
mySC[3].Box.HeaderLabel.Text = "SmartLabel.Color = Color.Red";
mySC[4].DefaultElement.SmartLabel.ForceVertical = true;
mySC[4].Box.HeaderLabel.Text = "ForceVertical = true;";
mySC[5].DefaultElement.SmartLabel.Hotspot.ToolTip = "%Name\n Tooltip";
mySC[5].Box.HeaderLabel.Text = "Hotspot.ToolTip = \"\\%Name\n Tooltip\"";
// Setup SmartPalette
Chart.SmartPalette.Add("*", new SmartColor(Color.FromArgb(240, 241, 251), new ScaleRange(0, 10)));
Chart.SmartPalette.Add("*", new SmartColor(Color.FromArgb(219, 222, 244), new ScaleRange(10, 20)));
Chart.SmartPalette.Add("*", new SmartColor(Color.FromArgb(191, 197, 236), new ScaleRange(20, 30)));
Chart.SmartPalette.Add("*", new SmartColor(Color.FromArgb(165, 174, 228), new ScaleRange(30, 40)));
Chart.SmartPalette.Add("*", new SmartColor(Color.FromArgb(135, 147, 220), new ScaleRange(40, 50)));
Chart.SmartPalette.Add("*", new SmartColor(Color.FromArgb(105, 120, 211), new ScaleRange(50, 60)));
}
SeriesCollection getRandomData()
{
Random myR = new Random(1);
SeriesCollection SC = new SeriesCollection();
for (int a = 1; a < 7; a++)
{
Series s = new Series("Series " + a.ToString());
for (int b = 1; b < 25; b++)
{
Element e = new Element("E" + b.ToString());
e.YValue = myR.Next(50);
s.Elements.Add(e);
}
SC.Add(s);
}
return SC;
}
SeriesCollection getLiveData()
{
DataEngine de = new DataEngine(ConfigurationManager.AppSettings["DNCConnectionString"]);
de.ChartObject = Chart; // Necessary to view any errors the dataEngine may throw.
de.SqlStatement = "SELECT XAxisColumn, YAxisColumn FROM ....";
return de.GetSeries();
}
</script>
<html xmlns="http://www.w3.org/1999/xhtml">
<head>
<title>.netCHARTING Sample</title>
</head>
<body>
<div align="center">
<dnc:Chart ID="Chart" runat="server" />
</div>
</body>
</html>
<%@ Page Language="vb" Description="dotnetCHARTING Component" %>
<%@ Register TagPrefix="dnc" Namespace="dotnetCHARTING" Assembly="dotnetCHARTING" %>
<%@ Import Namespace="System.Drawing" %>
<%@ Import Namespace="System.Drawing.Drawing2D" %>
<%@ Import Namespace="dotnetCHARTING.Mapping" %>
<script runat="server">
Sub Page_Load(ByVal sender As Object, ByVal e As EventArgs)
' Demonstrates using a single smart palette for all series and indivisual element label options.
Chart.Size = "750x450"
Chart.Title = "Element Labeling Options"
Chart.TempDirectory = "temp"
Chart.Debug = True
Chart.Type = ChartType.TreeMap
Chart.TitleBox.Position = TitleBoxPosition.FullWithLegend
Chart.DefaultSeries.LegendEntry.Visible = False
' Distance between series boxes
Chart.ChartArea.Padding = 6
' Default Element label settings
Chart.DefaultElement.ShowValue = True
Chart.DefaultElement.SmartLabel.Text = "%Name %YValue"
Chart.DefaultElement.SmartLabel.LineAlignment = StringAlignment.Center
Chart.DefaultElement.SmartLabel.Padding = 0
' Default series box settings.
Chart.DefaultSeries.Box.Header.VerticalAlignment = EdgeAlignment.Outside
Chart.DefaultSeries.Box.Header.StartAlignment = EdgeAlignment.Inside
Chart.DefaultSeries.Box.Header.StartCap = BoxCapStyle.CutDown
Chart.DefaultSeries.Box.Header.EndAlignment = EdgeAlignment.Inside
Chart.DefaultSeries.Box.Header.EndCap = BoxCapStyle.CutDown
' *DYNAMIC DATA NOTE*
' This sample uses random data to populate the chart. To populate
' a chart with database data see the following resources:
' - Use the getLiveData() method using the dataEngine to query a database.
' - Help File > Getting Started > Data Tutorials
' - DataEngine Class in the help file
' - Sample: features/DataEngine.aspx
Dim mySC As SeriesCollection = getRandomData()
' Add the random data.
Chart.SeriesCollection.Add(mySC)
mySC(0).DefaultElement.SmartLabel.Padding = 5
mySC(0).Box.HeaderLabel.Text = "Padding = 5;"
mySC(1).DefaultElement.ShowValue = False
mySC(1).Box.HeaderLabel.Text = "ShowValue = false"
mySC(2).DefaultElement.SmartLabel.DynamicDisplay = False
mySC(2).Box.HeaderLabel.Text = "DynamicDisplay = false" & Constants.vbLf & " All labels are forced to draw"
mySC(3).DefaultElement.SmartLabel.Color = Color.Red
mySC(3).Box.HeaderLabel.Text = "SmartLabel.Color = Color.Red"
mySC(4).DefaultElement.SmartLabel.ForceVertical = True
mySC(4).Box.HeaderLabel.Text = "ForceVertical = true;"
mySC(5).DefaultElement.SmartLabel.Hotspot.ToolTip = "%Name" & Constants.vbLf & " Tooltip"
mySC(5).Box.HeaderLabel.Text = "Hotspot.ToolTip = ""\%Name" & Constants.vbLf & " Tooltip"""
' Setup SmartPalette
Chart.SmartPalette.Add("*", New SmartColor(Color.FromArgb(240, 241, 251), New ScaleRange(0, 10)))
Chart.SmartPalette.Add("*", New SmartColor(Color.FromArgb(219, 222, 244), New ScaleRange(10, 20)))
Chart.SmartPalette.Add("*", New SmartColor(Color.FromArgb(191, 197, 236), New ScaleRange(20, 30)))
Chart.SmartPalette.Add("*", New SmartColor(Color.FromArgb(165, 174, 228), New ScaleRange(30, 40)))
Chart.SmartPalette.Add("*", New SmartColor(Color.FromArgb(135, 147, 220), New ScaleRange(40, 50)))
Chart.SmartPalette.Add("*", New SmartColor(Color.FromArgb(105, 120, 211), New ScaleRange(50, 60)))
End Sub
Function getRandomData() As SeriesCollection
Dim myR As Random = New Random(1)
Dim SC As SeriesCollection = New SeriesCollection()
For a As Integer = 1 To 6
Dim s As Series = New Series("Series " & a.ToString())
For b As Integer = 1 To 24
Dim e As Element = New Element("E" & b.ToString())
e.YValue = myR.Next(50)
s.Elements.Add(e)
Next b
SC.Add(s)
Next a
Return SC
End Function
Function getLiveData() As SeriesCollection
Dim de As DataEngine = New DataEngine(ConfigurationManager.AppSettings("DNCConnectionString"))
de.ChartObject = Chart ' Necessary to view any errors the dataEngine may throw.
de.SqlStatement = "SELECT XAxisColumn, YAxisColumn FROM ...."
Return de.GetSeries()
End Function
</script>
<html xmlns="http://www.w3.org/1999/xhtml">
<head>
<title>.netCHARTING Sample</title>
</head>
<body>
<div align="center">
<dnc:Chart ID="Chart" runat="server" />
</div>
</body>
</html>