// *DYNAMIC DATA NOTE* // This sample uses random data to populate the chart. To populate // a chart with database data see the following resources: // - Use the getLiveData() method using the dataEngine to query a database. // - Help File > Getting Started > Data Tutorials // - DataEngine Class in the help file // - Sample: features/DataEngine.aspx
SeriesCollection mySC = getRandomData();
// Add the random data. Chart.SeriesCollection.Add(mySC);
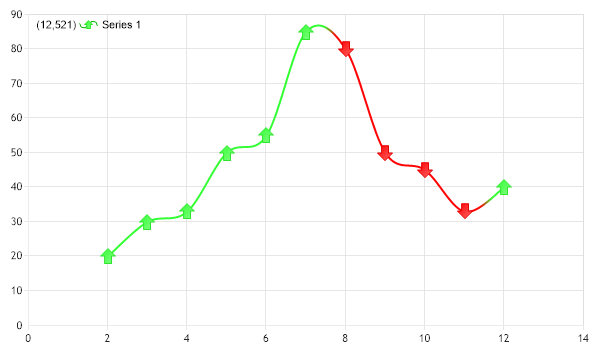
// Manually iterate the series and set the marker type and color. for (int i = 0; i < mySC[0].Elements.Count; i++) { if (i > 0) { if (mySC[0][i].YValue > mySC[0][i - 1].YValue) mySC[0][i].Marker.Type = ElementMarkerType.ArrowUp; else { mySC[0][i].Marker.Type = ElementMarkerType.ArrowDown; mySC[0][i].Color = Color.Red; } } }
}
SeriesCollection getRandomData() { Random myR = new Random(2); SeriesCollection SC = new SeriesCollection(); int a = 0, b = 2;
for (a = 1; a < 2; a++) { Series s = new Series("Series " + a.ToString()); foreach(double val in new double[]{20,30,33,50,55,85,80,50,45,33,40}) { Element e = new Element(); e.XValue = b++; e.YValue = val; s.Elements.Add(e); } SC.Add(s); } return SC; }
SeriesCollection getLiveData() { DataEngine de = new DataEngine("ConnectionString goes here"); de.ChartObject = Chart; // Necessary to view any errors the dataEngine may throw. de.SqlStatement = "SELECT XAxisColumn, YAxisColumn FROM ...."; return de.GetSeries(); }
' *DYNAMIC DATA NOTE* ' This sample uses random data to populate the chart. To populate ' a chart with database data see the following resources: ' - Use the getLiveData() method using the dataEngine to query a database. ' - Help File > Getting Started > Data Tutorials ' - DataEngine Class in the help file ' - Sample: features/DataEngine.aspx
Dim mySC As SeriesCollection = getRandomData()
' Add the random data. Chart.SeriesCollection.Add(mySC)
' Manually iterate the series and set the marker type and color. For i As Integer = 0 To mySC(0).Elements.Count - 1 If i > 0 Then If mySC(0)(i).YValue > mySC(0)(i - 1).YValue Then mySC(0)(i).Marker.Type = ElementMarkerType.ArrowUp Else mySC(0)(i).Marker.Type = ElementMarkerType.ArrowDown mySC(0)(i).Color = Color.Red End If End If Next i
End Sub
Function getRandomData() As SeriesCollection Dim myR As Random = New Random(2) Dim SC As SeriesCollection = New SeriesCollection() Dim a As Integer = 0, b As Integer = 2
For a = 1 To 1 Dim s As Series = New Series("Series " & a.ToString()) For Each val As Double In New Double(){20,30,33,50,55,85,80,50,45,33,40} Dim e As Element = New Element() e.XValue = b b += 1 e.YValue = val s.Elements.Add(e) Next val SC.Add(s) Next a Return SC End Function
Function getLiveData() As SeriesCollection Dim de As DataEngine = New DataEngine("ConnectionString goes here") de.ChartObject = Chart ' Necessary to view any errors the dataEngine may throw. de.SqlStatement = "SELECT XAxisColumn, YAxisColumn FROM ...." Return de.GetSeries() End Function