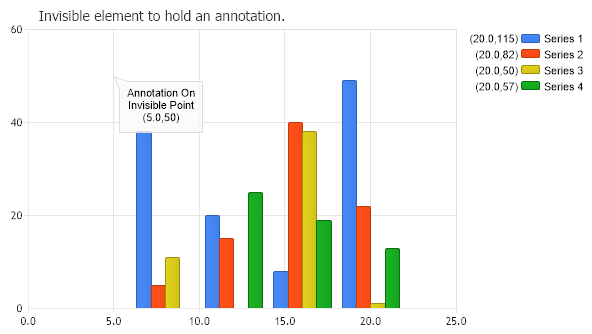
Gallery
Invisible Elements
<%@ Page Language="C#" Description="dotnetCHARTING Component" %>
<%@ Register TagPrefix="dotnet" Namespace="dotnetCHARTING" Assembly="dotnetCHARTING"%>
<%@ Import Namespace="System.Drawing" %>
<html xmlns="http://www.w3.org/1999/xhtml">
<head>
<title>.netCHARTING Sample</title>
<script runat="server">
void Page_Load(Object sender,EventArgs e)
{
Chart.Type = ChartType.Combo;//Horizontal;
Chart.Width = 600;
Chart.Height = 350;
Chart.TempDirectory = "temp";
Chart.Debug = true;
Chart.Title = "Invisible element to hold an annotation.";
// Demonstrates how an invisible element can be used to draw an
// annotation on the chart area at an exact axis value position.
// *DYNAMIC DATA NOTE*
// This sample uses random data to populate the chart. To populate
// a chart with database data see the following resources:
// - Classic samples folder
// - Help File > Data Tutorials
// - Sample: features/DataEngine.aspx
SeriesCollection mySC = getRandomData();
// Set up the element.
Element e1 = new Element("",50);
e1.XValue = 5;
e1.Annotation = new Annotation("Annotation On Invisible Point (%XValue,%YValue)");
// Create a series for it and set properties to make it invisible.
Series ser = new Series("",e1);
ser.Type = SeriesType.Marker;
ser.LegendEntry.Visible = false;
ser.DefaultElement.Color = Color.Empty;
// Add the series
Chart.SeriesCollection.Add(ser);
// Add the random data.
Chart.SeriesCollection.Add(mySC);
}
SeriesCollection getRandomData()
{
SeriesCollection SC = new SeriesCollection();
Random myR = new Random(2);
for(int a = 1; a < 5; a++)
{
Series s = new Series();
s.Name = "Series " + a;
for(int b = 1; b < 5; b++)
{
Element e = new Element();
e.XValue = (b+1)*4 ;
e.YValue = myR.Next(50);
s.Elements.Add(e);
}
SC.Add(s);
}
return SC;
}
</script>
</head>
<body>
<div style="text-align:center">
<dotnet:Chart id="Chart" runat="server" Width="568px" Height="344px">
</dotnet:Chart>
</div>
</body>
</html>
<%@ Page Language="vb" Description="dotnetCHARTING Component" %>
<%@ Register TagPrefix="dotnet" Namespace="dotnetCHARTING" Assembly="dotnetCHARTING"%>
<%@ Import Namespace="System.Drawing" %>
<html xmlns="http://www.w3.org/1999/xhtml">
<head>
<title>.netCHARTING Sample</title>
<script runat="server">
Sub Page_Load(ByVal sender As Object, ByVal e As EventArgs)
Chart.Type = ChartType.Combo 'Horizontal;
Chart.Width = 600
Chart.Height = 350
Chart.TempDirectory = "temp"
Chart.Debug = True
Chart.Title = "Invisible element to hold an annotation."
' Demonstrates how an invisible element can be used to draw an
' annotation on the chart area at an exact axis value position.
' *DYNAMIC DATA NOTE*
' This sample uses random data to populate the chart. To populate
' a chart with database data see the following resources:
' - Classic samples folder
' - Help File > Data Tutorials
' - Sample: features/DataEngine.aspx
Dim mySC As SeriesCollection = getRandomData()
' Set up the element.
Dim e1 As Element = New Element("",50)
e1.XValue = 5
e1.Annotation = New Annotation("Annotation On Invisible Point (%XValue,%YValue)")
' Create a series for it and set properties to make it invisible.
Dim ser As Series = New Series("",e1)
ser.Type = SeriesType.Marker
ser.LegendEntry.Visible = False
ser.DefaultElement.Color = Color.Empty
' Add the series
Chart.SeriesCollection.Add(ser)
' Add the random data.
Chart.SeriesCollection.Add(mySC)
End Sub
Function getRandomData() As SeriesCollection
Dim SC As SeriesCollection = New SeriesCollection()
Dim myR As Random = New Random(2)
For a As Integer = 1 To 4
Dim s As Series = New Series()
s.Name = "Series " & a
For b As Integer = 1 To 4
Dim e As Element = New Element()
e.XValue = (b+1)*4
e.YValue = myR.Next(50)
s.Elements.Add(e)
Next b
SC.Add(s)
Next a
Return SC
End Function
</script>
</head>
<body>
<div style="text-align:center">
<dotnet:Chart id="Chart" runat="server" Width="568px" Height="344px">
</dotnet:Chart>
</div>
</body>
</html>
- Sample FilenameInvisibleElements.aspx
- VersionLegacy (Pre 3.0)
- Uses DatabaseNo