Gallery
Org Db Clean
<%@ Page Language="C#" Description="dotnetCHARTING Component" %>
<%@ Register TagPrefix="dnc" Namespace="dotnetCHARTING" Assembly="dotnetCHARTING" %>
<%@ Import Namespace="System.Drawing" %>
<%@ Import Namespace="System.Drawing.Drawing2D" %>
<%@ Import Namespace="dotnetCHARTING.Mapping" %>
<script runat="server">
void Page_Load(Object sender, EventArgs e)
{
// Demonstrates making a simple tree organizational chart using the DB.
// Setup the chart
Chart.Size = "850x350";
Chart.TempDirectory = "temp";
Chart.Debug = true;
Chart.Type = ChartType.Organizational;
// Chart Styling
Chart.ChartArea.DefaultCorner = BoxCorner.Round;
Chart.ChartArea.CornerSize = 20;
Chart.ChartArea.Background.ShadingEffectMode = ShadingEffectMode.Background2;
Chart.ChartArea.Background.Color = Color.DarkGray;
Chart.ChartArea.Padding = 40;
// Node connecting line styling.
Chart.DefaultSeries.Line.Color = Color.Gray;
Chart.DefaultSeries.Line.Width = 3;
// Style the default annotation.
Chart.DefaultElement.Annotation = new Annotation();
Chart.DefaultElement.Annotation.Size = new Size(60, 18);
Chart.DefaultElement.Annotation.Label.Text = "<block fSize='12'>%Name";
Chart.DefaultElement.Annotation.ClearColors();
// Add the data.
Chart.SeriesCollection.Add(getLiveData());
}
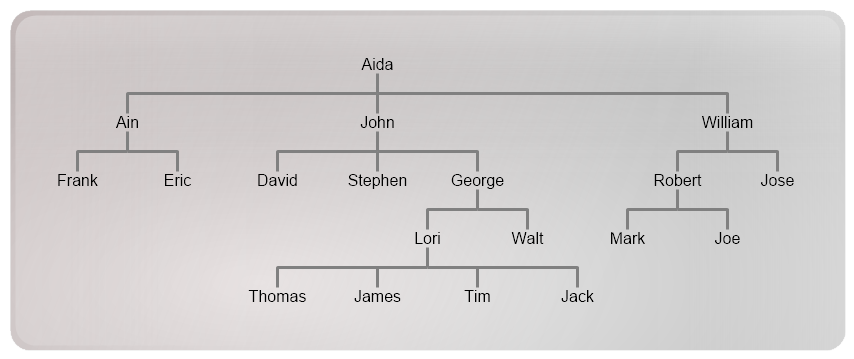
SeriesCollection getLiveData()
{
// Obtain series data from the database. Note this was created by adding PID (parentid)
// to an existing table only, then populating the parentid based on the hiearchy in place.
DataEngine de = new DataEngine(ConfigurationManager.AppSettings["DNCConnectionString"]);
de.SqlStatement = @"SELECT * FROM Employees";
de.DataFields = "InstanceID=ID,InstanceParentID=PID,Name=Name,office,Department,Email,Phone,Picture";
return de.GetSeries();
}
</script>
<html xmlns="http://www.w3.org/1999/xhtml">
<head>
<title>.netCHARTING Sample</title>
</head>
<body>
<div align="center">
<dnc:Chart ID="Chart" runat="server" />
</div>
</body>
</html>
<%@ Page Language="vb" Description="dotnetCHARTING Component" %>
<%@ Register TagPrefix="dnc" Namespace="dotnetCHARTING" Assembly="dotnetCHARTING" %>
<%@ Import Namespace="System.Drawing" %>
<%@ Import Namespace="System.Drawing.Drawing2D" %>
<%@ Import Namespace="dotnetCHARTING.Mapping" %>
<script runat="server">
Sub Page_Load(ByVal sender As Object, ByVal e As EventArgs)
' Demonstrates making a simple tree organizational chart using the DB.
' Setup the chart
Chart.Size = "850x350"
Chart.TempDirectory = "temp"
Chart.Debug = True
Chart.Type = ChartType.Organizational
' Chart Styling
Chart.ChartArea.DefaultCorner = BoxCorner.Round
Chart.ChartArea.CornerSize = 20
Chart.ChartArea.Background.ShadingEffectMode = ShadingEffectMode.Background2
Chart.ChartArea.Background.Color = Color.DarkGray
Chart.ChartArea.Padding = 40
' Node connecting line styling.
Chart.DefaultSeries.Line.Color = Color.Gray
Chart.DefaultSeries.Line.Width = 3
' Style the default annotation.
Chart.DefaultElement.Annotation = New Annotation()
Chart.DefaultElement.Annotation.Size = New Size(60, 18)
Chart.DefaultElement.Annotation.Label.Text = "<block fSize='12'>%Name"
Chart.DefaultElement.Annotation.ClearColors()
' Add the data.
Chart.SeriesCollection.Add(getLiveData())
End Sub
Function getLiveData() As SeriesCollection
' Obtain series data from the database. Note this was created by adding PID (parentid)
' to an existing table only, then populating the parentid based on the hiearchy in place.
Dim de As DataEngine = New DataEngine(ConfigurationManager.AppSettings("DNCConnectionString"))
de.SqlStatement = "SELECT * FROM Employees"
de.DataFields = "InstanceID=ID,InstanceParentID=PID,Name=Name,office,Department,Email,Phone,Picture"
Return de.GetSeries()
End Function
</script>
<html xmlns="http://www.w3.org/1999/xhtml">
<head>
<title>.netCHARTING Sample</title>
</head>
<body>
<div align="center">
<dnc:Chart ID="Chart" runat="server" />
</div>
</body>
</html>
- Sample FilenameOrgDbClean.aspx
- Version5.3
- Uses DatabaseYes